23/03/2007
Die Europameister
I can’t even comment on that…


 Filed by kargig at 21:03 under General,slogans
No Comments | 7,899 views
I can’t even comment on that…
Filed by kargig at 21:03 under General,slogans
No Comments | 7,899 views
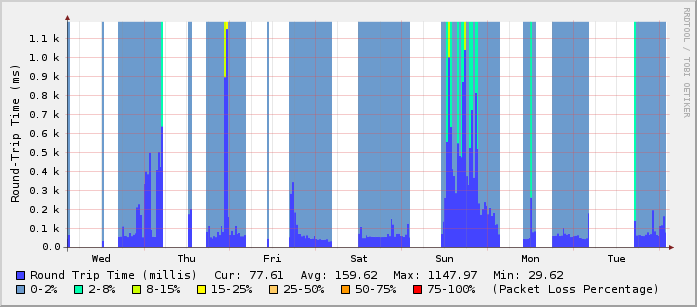
To get some nice graphs showing your round trip time and your packet loss, like the following image, follow the steps below:
What you need before you start: rrdtool and a cron server (vixie-cron is fine).
a) Execute the following
/usr/bin/rrdtool create /var/rrds/ping/ping_wan.rrd \

    --step 300 \

    DS:pl:GAUGE:600:0:100 \

    DS:rtt:GAUGE:600:0:10000000 \

    RRA:AVERAGE:0.5:1:800 \

    RRA:AVERAGE:0.5:6:800 \

    RRA:AVERAGE:0.5:24:800 \

    RRA:AVERAGE:0.5:288:800 \

    RRA:MAX:0.5:1:800 \

    RRA:MAX:0.5:6:800 \

    RRA:MAX:0.5:24:800 \

    RRA:MAX:0.5:288:800
You can change /var/rrds/ping/ping_wan.rrd to the path/file.rrd you wish.
b) Save the following to the file ping.sh
#!/bin/bash

PING=/bin/ping

COUNT=4

DEADLINE=10

ping_host() {

    local output=$($PING -q -n -c $COUNT -w $DEADLINE $1 2>&1)

    # notice $output is quoted to preserve newlines

    local temp=$(echo "$output"| awk '

        BEGIN           {pl=100; rtt=0.1}

        /packets transmitted/   {

            match($0, /([0-9]+)% packet loss/, matchstr)

            pl=matchstr[1]

        }

        /^rtt/          {

            # looking for something like 0.562/0.566/0.571/0.024

            match($4, /(.*)\/(.*)\/(.*)\/(.*)/, a)

            rtt=a[2]

        }

        /unknown host/  {

            # no output at all means network is probably down

            pl=100

            rtt=0.1

        }

        END             {print pl ":" rtt}

        ')

    RETURN_VALUE=$temp

}

# ping a host on the local lan

ping_host www.ntua.gr

/usr/bin/rrdtool update \

    /var/rrds/ping/ping_wan.rrd \

    --template \

    pl:rtt \

    N:$RETURN_VALUE
ping.sh.gz
Change the ping_host www.ntua.gr to the one of your choice. Make the script executable, chmod +x ping.sh.
If you have changed the /var/rrds/ping/ping_wan.rrd on step (a) you have to change it here too.
c) Save the following to ping-graph.sh and make it executable.
#!/bin/sh

cd /var/rrds/ping/

echo "

<HTML>

<HEAD><TITLE>Round-Trip and Packet Loss Stats</TITLE></HEAD>

        <BODY>

        <H3>Hourly Round-Trip & Packetloss Stats(1min average)</H3>

" > index.html

rrdtool graph ping_wan_hour.png -h 225 -w 600  -a PNG \

    --imginfo '<IMG SRC=/stats/%s WIDTH=%lu HEIGHT=%lu >' \

    --start -3600 --end -60 --x-grid MINUTE:10:HOUR:1:MINUTE:30:0:%R \

    -v "Round-Trip Time (ms)" \

    --rigid \

    --lower-limit 0 \

    DEF:roundtrip=ping_wan.rrd:rtt:AVERAGE \

    DEF:packetloss=ping_wan.rrd:pl:AVERAGE \

    CDEF:PLNone=packetloss,0,2,LIMIT,UN,UNKN,INF,IF \

    CDEF:PL2=packetloss,2,8,LIMIT,UN,UNKN,INF,IF \

    CDEF:PL15=packetloss,8,15,LIMIT,UN,UNKN,INF,IF \

    CDEF:PL25=packetloss,15,25,LIMIT,UN,UNKN,INF,IF \

    CDEF:PL50=packetloss,25,50,LIMIT,UN,UNKN,INF,IF \

    CDEF:PL75=packetloss,50,75,LIMIT,UN,UNKN,INF,IF \

    CDEF:PL100=packetloss,75,100,LIMIT,UN,UNKN,INF,IF \

    AREA:roundtrip#4444ff:"Round Trip Time (millis)" \

    GPRINT:roundtrip:LAST:"Cur\: %5.2lf" \

    GPRINT:roundtrip:AVERAGE:"Avg\: %5.2lf" \

    GPRINT:roundtrip:MAX:"Max\: %5.2lf" \

    GPRINT:roundtrip:MIN:"Min\: %5.2lf\n" \

    AREA:PLNone#6c9bcd:"0-2%":STACK \

    AREA:PL2#00ffae:"2-8%":STACK \

    AREA:PL15#ccff00:"8-15%":STACK \

    AREA:PL25#ffff00:"15-25%":STACK \

    AREA:PL50#ffcc66:"25-50%":STACK \

    AREA:PL75#ff9900:"50-75%":STACK \

    AREA:PL100#ff0000:"75-100%":STACK \

    COMMENT:"(Packet Loss Percentage)"

echo "

<img src="ping_wan_hour.png"><br>

<br>

<H3>Daily Round-Trip & Packetloss Stats(1min average)</H3>

" >> index.html

rrdtool graph ping_wan_day.png -h 225 -w 600  -a PNG \

    --imginfo '<IMG SRC=/stats/%s WIDTH=%lu HEIGHT=%lu >' \

    --lazy --start -86400 --end -60 --x-grid MINUTE:30:HOUR:1:HOUR:2:0:%H \

    -v "Round-Trip Time (ms)" \

    --rigid \

    --lower-limit 0 \

    DEF:roundtrip=ping_wan.rrd:rtt:AVERAGE \

    DEF:packetloss=ping_wan.rrd:pl:AVERAGE \

    CDEF:PLNone=packetloss,0,2,LIMIT,UN,UNKN,INF,IF \

    CDEF:PL2=packetloss,2,8,LIMIT,UN,UNKN,INF,IF \

    CDEF:PL15=packetloss,8,15,LIMIT,UN,UNKN,INF,IF \

    CDEF:PL25=packetloss,15,25,LIMIT,UN,UNKN,INF,IF \

    CDEF:PL50=packetloss,25,50,LIMIT,UN,UNKN,INF,IF \

    CDEF:PL75=packetloss,50,75,LIMIT,UN,UNKN,INF,IF \

    CDEF:PL100=packetloss,75,100,LIMIT,UN,UNKN,INF,IF \

    AREA:roundtrip#4444ff:"Round Trip Time (millis)" \

    GPRINT:roundtrip:LAST:"Cur\: %5.2lf" \

    GPRINT:roundtrip:AVERAGE:"Avg\: %5.2lf" \

    GPRINT:roundtrip:MAX:"Max\: %5.2lf" \

    GPRINT:roundtrip:MIN:"Min\: %5.2lf\n" \

    AREA:PLNone#6c9bcd:"0-2%":STACK \

    AREA:PL2#00ffae:"2-8%":STACK \

    AREA:PL15#ccff00:"8-15%":STACK \

    AREA:PL25#ffff00:"15-25%":STACK \

    AREA:PL50#ffcc66:"25-50%":STACK \

    AREA:PL75#ff9900:"50-75%":STACK \

    AREA:PL100#ff0000:"75-100%":STACK \

    COMMENT:"(Packet Loss Percentage)"

echo "

<img src="ping_wan_day.png"><br>

<br>

<H3>Weekly Round-Trip & Packetloss Stats(1min average)</H3>

" >> index.html

rrdtool graph ping_wan_week.png -h 225 -w 600 -a PNG \

    --imginfo '<IMG SRC=/stats/%s WIDTH=%lu HEIGHT=%lu >' \

    --lazy --start -604800 --end -1800 \

    -v "Round-Trip Time (ms)" \

    --rigid \

    --lower-limit 0 \

    DEF:roundtrip=ping_wan.rrd:rtt:AVERAGE \

    DEF:packetloss=ping_wan.rrd:pl:AVERAGE \

    CDEF:PLNone=packetloss,0,2,LIMIT,UN,UNKN,INF,IF \

    CDEF:PL2=packetloss,2,8,LIMIT,UN,UNKN,INF,IF \

    CDEF:PL15=packetloss,8,15,LIMIT,UN,UNKN,INF,IF \

    CDEF:PL25=packetloss,15,25,LIMIT,UN,UNKN,INF,IF \

    CDEF:PL50=packetloss,25,50,LIMIT,UN,UNKN,INF,IF \

    CDEF:PL75=packetloss,50,75,LIMIT,UN,UNKN,INF,IF \

    CDEF:PL100=packetloss,75,100,LIMIT,UN,UNKN,INF,IF \

    AREA:roundtrip#4444ff:"Round Trip Time (millis)" \

    GPRINT:roundtrip:LAST:"Cur\: %5.2lf" \

    GPRINT:roundtrip:AVERAGE:"Avg\: %5.2lf" \

    GPRINT:roundtrip:MAX:"Max\: %5.2lf" \

    GPRINT:roundtrip:MIN:"Min\: %5.2lf\n" \

    AREA:PLNone#6c9bcd:"0-2%":STACK \

    AREA:PL2#00ffae:"2-8%":STACK \

    AREA:PL15#ccff00:"8-15%":STACK \

    AREA:PL25#ffff00:"15-25%":STACK \

    AREA:PL50#ffcc66:"25-50%":STACK \

    AREA:PL75#ff9900:"50-75%":STACK \

    AREA:PL100#ff0000:"75-100%":STACK \

    COMMENT:"(Packet Loss Percentage)"

echo "

<img src="ping_wan_week.png"><br>

<br>

<H3>Monthly Round-Trip & Packetloss Stats(1min average)</H3>

" >> index.html

rrdtool graph ping_wan_month.png -h 225 -w 600 -a PNG \

        --imginfo '<IMG SRC=/stats/%s WIDTH=%lu HEIGHT=%lu >' \

        --lazy --start -2592000 --end -7200 \

    -v "Round-Trip Time (ms)" \

    --rigid \

    --lower-limit 0 \

    DEF:roundtrip=ping_wan.rrd:rtt:AVERAGE \

    DEF:packetloss=ping_wan.rrd:pl:AVERAGE \

    CDEF:PLNone=packetloss,0,2,LIMIT,UN,UNKN,INF,IF \

    CDEF:PL2=packetloss,2,8,LIMIT,UN,UNKN,INF,IF \

    CDEF:PL15=packetloss,8,15,LIMIT,UN,UNKN,INF,IF \

    CDEF:PL25=packetloss,15,25,LIMIT,UN,UNKN,INF,IF \

    CDEF:PL50=packetloss,25,50,LIMIT,UN,UNKN,INF,IF \

    CDEF:PL75=packetloss,50,75,LIMIT,UN,UNKN,INF,IF \

    CDEF:PL100=packetloss,75,100,LIMIT,UN,UNKN,INF,IF \

    AREA:roundtrip#4444ff:"Round Trip Time (millis)" \

    GPRINT:roundtrip:LAST:"Cur\: %5.2lf" \

    GPRINT:roundtrip:AVERAGE:"Avg\: %5.2lf" \

    GPRINT:roundtrip:MAX:"Max\: %5.2lf" \

    GPRINT:roundtrip:MIN:"Min\: %5.2lf\n" \

    AREA:PLNone#6c9bcd:"0-2%":STACK \

    AREA:PL2#00ffae:"2-8%":STACK \

    AREA:PL15#ccff00:"8-15%":STACK \

    AREA:PL25#ffff00:"15-25%":STACK \

    AREA:PL50#ffcc66:"25-50%":STACK \

    AREA:PL75#ff9900:"50-75%":STACK \

    AREA:PL100#ff0000:"75-100%":STACK \

    COMMENT:"(Packet Loss Percentage)"

echo "

<img src="ping_wan_month.png"><br>

<br>

<H3>Yearly Round-Trip & Packetloss Stats(1min average)</H3>

" >> index.html

rrdtool graph ping_wan_year.png \

        --imginfo '<IMG SRC=/stats/%s WIDTH=%lu HEIGHT=%lu >' \

        --lazy --start -31536000 --end -86400 -h 225 -w 600 -a PNG \

    -v "Round-Trip Time (ms)" \

    --rigid \

    --lower-limit 0 \

    DEF:roundtrip=ping_wan.rrd:rtt:AVERAGE \

    DEF:packetloss=ping_wan.rrd:pl:AVERAGE \

    CDEF:PLNone=packetloss,0,2,LIMIT,UN,UNKN,INF,IF \

    CDEF:PL2=packetloss,2,8,LIMIT,UN,UNKN,INF,IF \

    CDEF:PL15=packetloss,8,15,LIMIT,UN,UNKN,INF,IF \

    CDEF:PL25=packetloss,15,25,LIMIT,UN,UNKN,INF,IF \

    CDEF:PL50=packetloss,25,50,LIMIT,UN,UNKN,INF,IF \

    CDEF:PL75=packetloss,50,75,LIMIT,UN,UNKN,INF,IF \

    CDEF:PL100=packetloss,75,100,LIMIT,UN,UNKN,INF,IF \

    AREA:roundtrip#4444ff:"Round Trip Time (millis)" \

    GPRINT:roundtrip:LAST:"Cur\: %5.2lf" \

    GPRINT:roundtrip:AVERAGE:"Avg\: %5.2lf" \

    GPRINT:roundtrip:MAX:"Max\: %5.2lf" \

    GPRINT:roundtrip:MIN:"Min\: %5.2lf\n" \

    AREA:PLNone#6c9bcd:"0-2%":STACK \

    AREA:PL2#00ffae:"2-8%":STACK \

    AREA:PL15#ccff00:"8-15%":STACK \

    AREA:PL25#ffff00:"15-25%":STACK \

    AREA:PL50#ffcc66:"25-50%":STACK \

    AREA:PL75#ff9900:"50-75%":STACK \

    AREA:PL100#ff0000:"75-100%":STACK \

    COMMENT:"(Packet Loss Percentage)"

echo "

<img src="ping_wan_year.png"><br>

<br>

</BODY>

</HTML>

" >> index.html
If you have changed /var/rrds/ping on step (a) you need to change it here in the beggining of the script too.
The above script creates a very simple index.html file inside /var/rrds/ping (unless you’ve changed it) with 5 graphs: hourly, daily, weekly, monthly and yearly
d) Add the following entries to your crontab:
*/5 * * * * /etc/mrtg/ping.sh

1,6,11,16,21,26,31,36,41,46,51,56 * * * * /path/to/ping-graph.sh
For better accuracy, you can change “–step 300” to “–step 60” in the rrd database creation script and then change the crontab entry for ping.sh from:
*/5 * * * * /etc/mrtg/ping.sh
to
* * * * * /etc/mrtg/ping.sh
Original ping script and rrd config for the graphs from http://haroon.sis.utoronto.ca/rrd/scripts/
Enjoy your graphs.
Filed by kargig at 04:04 under Linux,Networking
 15 Comments | 36,066 views
Today I had to format a PC and install Windows XP on a new disk for a guy I know. The PC was pretty old but I would never guess what I would find out inside it.
Check these two pics:


Yeap…there are peanuts inside!
Anyway, I installed the new hard disk inside, inserted the Windows XP installation disc (SP2 included) and my torture began. The PC specs were P4 1.6GHz with 256Mb RAM. The installation process took around 70 minutes including the 20 minute NTFS format of the new hard disk. I thought it was wiser not to quick format it and select the normal format method. Why is NTFS so slow when it comes to formatting ? 20 minutes for an 80Gb hard disk is an overkill….I formatted a new 800Gb ext3 (software) raid partition on linux, one month ago, in less than 10 minutes…
After those boring 70 minutes the installation was finally over. I rebooted the PC and faced a crawling machine. Responsiveness came back only after I disabled all visual enhancements and made it look like win2k. Still I had a huge problem though … drivers. I didn’t know the model name of the motherboard and the soundcard was onboard. Since the machine will be put someplace in order to only play some MP3s, I had to at least make the soundcard work. I took another look at the pictures (posted above) and I saw the motherboard model number sticker. I googled it and found some AGP and sound drivers and I was finally able to make it play some music.
My first question/rant is this…In Linux I have the lspci command that comes in every (as far as I know) installation and shows you the output of your PCs’ contents, what would I do in a default Windows installation if I hadn’t opened the PC and checked on the motherboards’ model number ? Is there a way to find out what’s inside the PC (with a default install) ? Oh well…in Linux I don’t even need to know my soundcard’s name because the linux kernel autodetects the proper module (aka driver for the windows readers of this post) and loads it. That simple.
And the second question/rant that comes to my mind… I read in many forums that people are really “mad” at Linux not being able to play their DVDs on the default installation. I wasn’t even able to make Windows see the onboard soundcard on the default installation and I had to download drivers from another pc (no network), would it play DVDs ? I guess not. So either most people use pirated Windows installation CDs/DVDs with programs like powerdvd pre-installed or they are just lying.
I hope Vista does not need to download drivers just to recognize an onboard soundcard…
How is a windows user benefited by the fact that Windows can (illegally) play MP3s while Linux needs to legally download the codecs, when Windows cannot even recognize the soundcard and play _any_ sound at all ?
Filed by kargig at 21:26 under Linux
No Comments | 3,526 views
| M | T | W | T | F | S | S |
|---|---|---|---|---|---|---|
| 1 | 2 | 3 | 4 | |||
| 5 | 6 | 7 | 8 | 9 | 10 | 11 |
| 12 | 13 | 14 | 15 | 16 | 17 | 18 |
| 19 | 20 | 21 | 22 | 23 | 24 | 25 |
| 26 | 27 | 28 | 29 | 30 | 31 | |