21/03/2007
Round Trip and Packet Loss stats with rrdtool
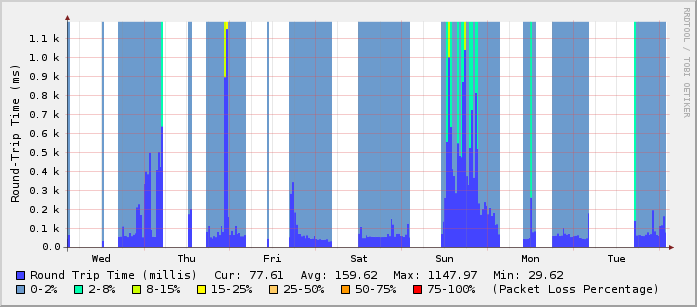
To get some nice graphs showing your round trip time and your packet loss, like the following image, follow the steps below:
What you need before you start: rrdtool and a cron server (vixie-cron is fine).
a) Execute the following
/usr/bin/rrdtool create /var/rrds/ping/ping_wan.rrd \

    --step 300 \

    DS:pl:GAUGE:600:0:100 \

    DS:rtt:GAUGE:600:0:10000000 \

    RRA:AVERAGE:0.5:1:800 \

    RRA:AVERAGE:0.5:6:800 \

    RRA:AVERAGE:0.5:24:800 \

    RRA:AVERAGE:0.5:288:800 \

    RRA:MAX:0.5:1:800 \

    RRA:MAX:0.5:6:800 \

    RRA:MAX:0.5:24:800 \

    RRA:MAX:0.5:288:800
You can change /var/rrds/ping/ping_wan.rrd to the path/file.rrd you wish.
b) Save the following to the file ping.sh
#!/bin/bash

PING=/bin/ping

COUNT=4

DEADLINE=10

ping_host() {

    local output=$($PING -q -n -c $COUNT -w $DEADLINE $1 2>&1)

    # notice $output is quoted to preserve newlines

    local temp=$(echo "$output"| awk '

        BEGIN           {pl=100; rtt=0.1}

        /packets transmitted/   {

            match($0, /([0-9]+)% packet loss/, matchstr)

            pl=matchstr[1]

        }

        /^rtt/          {

            # looking for something like 0.562/0.566/0.571/0.024

            match($4, /(.*)\/(.*)\/(.*)\/(.*)/, a)

            rtt=a[2]

        }

        /unknown host/  {

            # no output at all means network is probably down

            pl=100

            rtt=0.1

        }

        END             {print pl ":" rtt}

        ')

    RETURN_VALUE=$temp

}

# ping a host on the local lan

ping_host www.ntua.gr

/usr/bin/rrdtool update \

    /var/rrds/ping/ping_wan.rrd \

    --template \

    pl:rtt \

    N:$RETURN_VALUE
ping.sh.gz
Change the ping_host www.ntua.gr to the one of your choice. Make the script executable, chmod +x ping.sh.
If you have changed the /var/rrds/ping/ping_wan.rrd on step (a) you have to change it here too.
c) Save the following to ping-graph.sh and make it executable.
#!/bin/sh

cd /var/rrds/ping/

echo "

<HTML>

<HEAD><TITLE>Round-Trip and Packet Loss Stats</TITLE></HEAD>

        <BODY>

        <H3>Hourly Round-Trip & Packetloss Stats(1min average)</H3>

" > index.html

rrdtool graph ping_wan_hour.png -h 225 -w 600  -a PNG \

    --imginfo '<IMG SRC=/stats/%s WIDTH=%lu HEIGHT=%lu >' \

    --start -3600 --end -60 --x-grid MINUTE:10:HOUR:1:MINUTE:30:0:%R \

    -v "Round-Trip Time (ms)" \

    --rigid \

    --lower-limit 0 \

    DEF:roundtrip=ping_wan.rrd:rtt:AVERAGE \

    DEF:packetloss=ping_wan.rrd:pl:AVERAGE \

    CDEF:PLNone=packetloss,0,2,LIMIT,UN,UNKN,INF,IF \

    CDEF:PL2=packetloss,2,8,LIMIT,UN,UNKN,INF,IF \

    CDEF:PL15=packetloss,8,15,LIMIT,UN,UNKN,INF,IF \

    CDEF:PL25=packetloss,15,25,LIMIT,UN,UNKN,INF,IF \

    CDEF:PL50=packetloss,25,50,LIMIT,UN,UNKN,INF,IF \

    CDEF:PL75=packetloss,50,75,LIMIT,UN,UNKN,INF,IF \

    CDEF:PL100=packetloss,75,100,LIMIT,UN,UNKN,INF,IF \

    AREA:roundtrip#4444ff:"Round Trip Time (millis)" \

    GPRINT:roundtrip:LAST:"Cur\: %5.2lf" \

    GPRINT:roundtrip:AVERAGE:"Avg\: %5.2lf" \

    GPRINT:roundtrip:MAX:"Max\: %5.2lf" \

    GPRINT:roundtrip:MIN:"Min\: %5.2lf\n" \

    AREA:PLNone#6c9bcd:"0-2%":STACK \

    AREA:PL2#00ffae:"2-8%":STACK \

    AREA:PL15#ccff00:"8-15%":STACK \

    AREA:PL25#ffff00:"15-25%":STACK \

    AREA:PL50#ffcc66:"25-50%":STACK \

    AREA:PL75#ff9900:"50-75%":STACK \

    AREA:PL100#ff0000:"75-100%":STACK \

    COMMENT:"(Packet Loss Percentage)"

echo "

<img src="ping_wan_hour.png"><br>

<br>

<H3>Daily Round-Trip & Packetloss Stats(1min average)</H3>

" >> index.html

rrdtool graph ping_wan_day.png -h 225 -w 600  -a PNG \

    --imginfo '<IMG SRC=/stats/%s WIDTH=%lu HEIGHT=%lu >' \

    --lazy --start -86400 --end -60 --x-grid MINUTE:30:HOUR:1:HOUR:2:0:%H \

    -v "Round-Trip Time (ms)" \

    --rigid \

    --lower-limit 0 \

    DEF:roundtrip=ping_wan.rrd:rtt:AVERAGE \

    DEF:packetloss=ping_wan.rrd:pl:AVERAGE \

    CDEF:PLNone=packetloss,0,2,LIMIT,UN,UNKN,INF,IF \

    CDEF:PL2=packetloss,2,8,LIMIT,UN,UNKN,INF,IF \

    CDEF:PL15=packetloss,8,15,LIMIT,UN,UNKN,INF,IF \

    CDEF:PL25=packetloss,15,25,LIMIT,UN,UNKN,INF,IF \

    CDEF:PL50=packetloss,25,50,LIMIT,UN,UNKN,INF,IF \

    CDEF:PL75=packetloss,50,75,LIMIT,UN,UNKN,INF,IF \

    CDEF:PL100=packetloss,75,100,LIMIT,UN,UNKN,INF,IF \

    AREA:roundtrip#4444ff:"Round Trip Time (millis)" \

    GPRINT:roundtrip:LAST:"Cur\: %5.2lf" \

    GPRINT:roundtrip:AVERAGE:"Avg\: %5.2lf" \

    GPRINT:roundtrip:MAX:"Max\: %5.2lf" \

    GPRINT:roundtrip:MIN:"Min\: %5.2lf\n" \

    AREA:PLNone#6c9bcd:"0-2%":STACK \

    AREA:PL2#00ffae:"2-8%":STACK \

    AREA:PL15#ccff00:"8-15%":STACK \

    AREA:PL25#ffff00:"15-25%":STACK \

    AREA:PL50#ffcc66:"25-50%":STACK \

    AREA:PL75#ff9900:"50-75%":STACK \

    AREA:PL100#ff0000:"75-100%":STACK \

    COMMENT:"(Packet Loss Percentage)"

echo "

<img src="ping_wan_day.png"><br>

<br>

<H3>Weekly Round-Trip & Packetloss Stats(1min average)</H3>

" >> index.html

rrdtool graph ping_wan_week.png -h 225 -w 600 -a PNG \

    --imginfo '<IMG SRC=/stats/%s WIDTH=%lu HEIGHT=%lu >' \

    --lazy --start -604800 --end -1800 \

    -v "Round-Trip Time (ms)" \

    --rigid \

    --lower-limit 0 \

    DEF:roundtrip=ping_wan.rrd:rtt:AVERAGE \

    DEF:packetloss=ping_wan.rrd:pl:AVERAGE \

    CDEF:PLNone=packetloss,0,2,LIMIT,UN,UNKN,INF,IF \

    CDEF:PL2=packetloss,2,8,LIMIT,UN,UNKN,INF,IF \

    CDEF:PL15=packetloss,8,15,LIMIT,UN,UNKN,INF,IF \

    CDEF:PL25=packetloss,15,25,LIMIT,UN,UNKN,INF,IF \

    CDEF:PL50=packetloss,25,50,LIMIT,UN,UNKN,INF,IF \

    CDEF:PL75=packetloss,50,75,LIMIT,UN,UNKN,INF,IF \

    CDEF:PL100=packetloss,75,100,LIMIT,UN,UNKN,INF,IF \

    AREA:roundtrip#4444ff:"Round Trip Time (millis)" \

    GPRINT:roundtrip:LAST:"Cur\: %5.2lf" \

    GPRINT:roundtrip:AVERAGE:"Avg\: %5.2lf" \

    GPRINT:roundtrip:MAX:"Max\: %5.2lf" \

    GPRINT:roundtrip:MIN:"Min\: %5.2lf\n" \

    AREA:PLNone#6c9bcd:"0-2%":STACK \

    AREA:PL2#00ffae:"2-8%":STACK \

    AREA:PL15#ccff00:"8-15%":STACK \

    AREA:PL25#ffff00:"15-25%":STACK \

    AREA:PL50#ffcc66:"25-50%":STACK \

    AREA:PL75#ff9900:"50-75%":STACK \

    AREA:PL100#ff0000:"75-100%":STACK \

    COMMENT:"(Packet Loss Percentage)"

echo "

<img src="ping_wan_week.png"><br>

<br>

<H3>Monthly Round-Trip & Packetloss Stats(1min average)</H3>

" >> index.html

rrdtool graph ping_wan_month.png -h 225 -w 600 -a PNG \

        --imginfo '<IMG SRC=/stats/%s WIDTH=%lu HEIGHT=%lu >' \

        --lazy --start -2592000 --end -7200 \

    -v "Round-Trip Time (ms)" \

    --rigid \

    --lower-limit 0 \

    DEF:roundtrip=ping_wan.rrd:rtt:AVERAGE \

    DEF:packetloss=ping_wan.rrd:pl:AVERAGE \

    CDEF:PLNone=packetloss,0,2,LIMIT,UN,UNKN,INF,IF \

    CDEF:PL2=packetloss,2,8,LIMIT,UN,UNKN,INF,IF \

    CDEF:PL15=packetloss,8,15,LIMIT,UN,UNKN,INF,IF \

    CDEF:PL25=packetloss,15,25,LIMIT,UN,UNKN,INF,IF \

    CDEF:PL50=packetloss,25,50,LIMIT,UN,UNKN,INF,IF \

    CDEF:PL75=packetloss,50,75,LIMIT,UN,UNKN,INF,IF \

    CDEF:PL100=packetloss,75,100,LIMIT,UN,UNKN,INF,IF \

    AREA:roundtrip#4444ff:"Round Trip Time (millis)" \

    GPRINT:roundtrip:LAST:"Cur\: %5.2lf" \

    GPRINT:roundtrip:AVERAGE:"Avg\: %5.2lf" \

    GPRINT:roundtrip:MAX:"Max\: %5.2lf" \

    GPRINT:roundtrip:MIN:"Min\: %5.2lf\n" \

    AREA:PLNone#6c9bcd:"0-2%":STACK \

    AREA:PL2#00ffae:"2-8%":STACK \

    AREA:PL15#ccff00:"8-15%":STACK \

    AREA:PL25#ffff00:"15-25%":STACK \

    AREA:PL50#ffcc66:"25-50%":STACK \

    AREA:PL75#ff9900:"50-75%":STACK \

    AREA:PL100#ff0000:"75-100%":STACK \

    COMMENT:"(Packet Loss Percentage)"

echo "

<img src="ping_wan_month.png"><br>

<br>

<H3>Yearly Round-Trip & Packetloss Stats(1min average)</H3>

" >> index.html

rrdtool graph ping_wan_year.png \

        --imginfo '<IMG SRC=/stats/%s WIDTH=%lu HEIGHT=%lu >' \

        --lazy --start -31536000 --end -86400 -h 225 -w 600 -a PNG \

    -v "Round-Trip Time (ms)" \

    --rigid \

    --lower-limit 0 \

    DEF:roundtrip=ping_wan.rrd:rtt:AVERAGE \

    DEF:packetloss=ping_wan.rrd:pl:AVERAGE \

    CDEF:PLNone=packetloss,0,2,LIMIT,UN,UNKN,INF,IF \

    CDEF:PL2=packetloss,2,8,LIMIT,UN,UNKN,INF,IF \

    CDEF:PL15=packetloss,8,15,LIMIT,UN,UNKN,INF,IF \

    CDEF:PL25=packetloss,15,25,LIMIT,UN,UNKN,INF,IF \

    CDEF:PL50=packetloss,25,50,LIMIT,UN,UNKN,INF,IF \

    CDEF:PL75=packetloss,50,75,LIMIT,UN,UNKN,INF,IF \

    CDEF:PL100=packetloss,75,100,LIMIT,UN,UNKN,INF,IF \

    AREA:roundtrip#4444ff:"Round Trip Time (millis)" \

    GPRINT:roundtrip:LAST:"Cur\: %5.2lf" \

    GPRINT:roundtrip:AVERAGE:"Avg\: %5.2lf" \

    GPRINT:roundtrip:MAX:"Max\: %5.2lf" \

    GPRINT:roundtrip:MIN:"Min\: %5.2lf\n" \

    AREA:PLNone#6c9bcd:"0-2%":STACK \

    AREA:PL2#00ffae:"2-8%":STACK \

    AREA:PL15#ccff00:"8-15%":STACK \

    AREA:PL25#ffff00:"15-25%":STACK \

    AREA:PL50#ffcc66:"25-50%":STACK \

    AREA:PL75#ff9900:"50-75%":STACK \

    AREA:PL100#ff0000:"75-100%":STACK \

    COMMENT:"(Packet Loss Percentage)"

echo "

<img src="ping_wan_year.png"><br>

<br>

</BODY>

</HTML>

" >> index.html
If you have changed /var/rrds/ping on step (a) you need to change it here in the beggining of the script too.
The above script creates a very simple index.html file inside /var/rrds/ping (unless you’ve changed it) with 5 graphs: hourly, daily, weekly, monthly and yearly
d) Add the following entries to your crontab:
*/5 * * * * /etc/mrtg/ping.sh

1,6,11,16,21,26,31,36,41,46,51,56 * * * * /path/to/ping-graph.sh
For better accuracy, you can change “–step 300” to “–step 60” in the rrd database creation script and then change the crontab entry for ping.sh from:
*/5 * * * * /etc/mrtg/ping.sh
to
* * * * * /etc/mrtg/ping.sh
Original ping script and rrd config for the graphs from http://haroon.sis.utoronto.ca/rrd/scripts/
Enjoy your graphs.
 Filed by kargig at 04:04 under Linux,Networking
 15 Comments | 35,372 views

copy/paste of ping.sh gives me:
awk: line 4: syntax error at or near ,
awk: line 9: syntax error at or near ,
I’ve updated the post and included a ping.sh.gz file beneath the code. gunzip it and use it. It worked for me.
I have successfully created the graph, but 2 questions
1st]
Currently I am running 14all.cgi to monitor various targets,
How I can add this ping graph to the main screen of 14all.cgi so it should show with all other targets.
2nd] How can I monitor ping Multiple Targets ?
1) I guess you’ll have to make an entry inside your mrtg config that would run a somewhat modified ping.sh to suit your needs. My version was not made for this kind of usage…but you can modify it to your needs.
2) You would have to edit the create script in order to include multiple DS settings and of course edit the ping.sh script to update the DS per target.
Or you can create multiple graphs, one per ping target
If you modify any of the above scripts please let me know of your changes 🙂
Actually I have no experience in Scripting, I thought there would be some ready made stuff available to merge the RRD PING GRAPH with all other targets (in 14all.cgi)
Can u give me hints on howto merge this graph with other targets.
Still :
awk: line 4: syntax error at or near ,
awk: line 9: syntax error at or near ,
Did u try the ping.sh.gz file ? copy paste from the blog needs special attention to the quotes…Since it has worked for other people (and me) I don’t think there’s an error in the code. Probably some copy/paste mess..
To all peopple having troubles with awk syntax errors – install gawk instead of mawk (which is default at least on ubuntu-server-8.04).
I followed instructions, graphs work (kinda) but they are incremented from 0ms to 1ms — kinda useless since most ping response times will be well over 1ms. How to change so that it runs from 0ms to 1000ms?
Thanks works great.
Thanks. worked for me after installing gawk.
I was getting
awk: line 4: syntax error at or near ,
awk: line 9: syntax error at or near ,
ERROR: /opt/rrd/ping/ping_wan.rrd: expected 2 data source readings (got 2) from N
How can we use this interesting script to monitor other services like asterisk, mysql, http or some custom service.
There is a way to install a zoom utility?, like cacti.
Thanks in advance.
Hi there, i’ve done everything correctly. I can execute .sh files with no errors, added them to cron and they are running. My graphs were created, but i see no updates. When I do a dump of pin_wan.rrd, i only see NaN which is what shows up on my graphs as well. did i miss something?
thank you
There is edited version of ping.sh for Linksys (tested on WRT54GL) with Tomato 1.28 (BusyBox 1.14.4), I hope it will be useful for beginers 😉
http://pastebin.com/kAf0D0z8
awk syntax error happens because awk which comes with raspberry by default is not a GNU awk and does not support storage of strings in arrays. It accepts only 2 parameters — string and regexp. To make this script work you need to install gawk