12/04/2020
Graphing Covid-19 related data for Greece using Elastic’s ElasticSearch Service
TL;DR
Intro
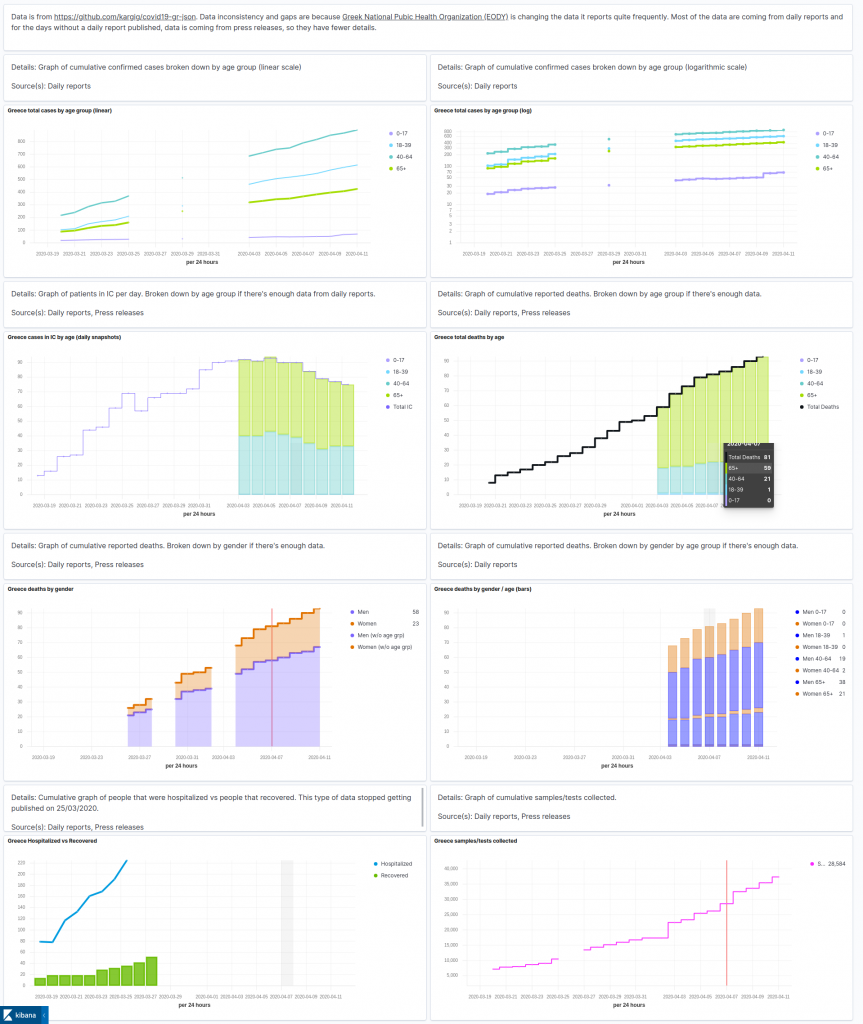
A few weeks ago I started converting the Covid-19 daily reports from Greek National Public Health Organization (EODY) to json documents, and publishing them to Github in a repository called covid19-gr-json. Reasoning behind this effort was that EODY does not publish their data in a reusable format, one that “machines” can easily read and parse. There are many websites that have created their own Covid-19 graphs but most of them have very basic stats (cases/day, deaths/day) and they state that their data sources are coming from media sources, without letting you access and re-use their original data. I haven’t been able to locate any other open data set regarding Covid-19 data for Greece that is not based on media sources but from official data coming out of EODY.
Report frequency and data consistency
After a few days of trying to convert these daily reports to json, EODY stopped publishing them. 3 days later EODY published another report with a different set of metrics than the previous reports. This new report did not have a per region analysis of cases and EODY also stopped publishing data for the number of hospitalized people or how many people have recovered. 4 more days passed without a report. Then EODY started publishing daily reports again, we’re now at 9 days in a row, but the metrics are again different than the previous ones published. There’s now a drill down by age and gender regarding cases, deaths and people in intensive care (IC). Still no mention of how many people have recovered though or how many are hospitalized but are not in IC. The result is that json files in the repository cannot be consistent since the original sources are not consistent. Such is life.
Visualizing data
A few days had passed since I started converting pdf reports to json and I wanted to see how easy it is to visualize some of it. Since data were in json format, the easiest thing for me to do was to store them to an Elasticsearch cluster and create visualizations using Kibana. Working at Elastic has its perks, I created a new Elastic stack deployment in ElasticSearch Service (ESS), and posted the json documents to it. I had to make a tough decision though, which graph tool from Kibana to use to visualize data. I started using line graphs but soon switched to Time Series Visual Builder (TSVB) as it’s easier to use and allows to visualize multiple metrics/time series in the same graph. I believe it’s producing way more beautiful visualizations anyway. After creating some visualizations I also created a dashboard, took some screenshots and shared them with friends.
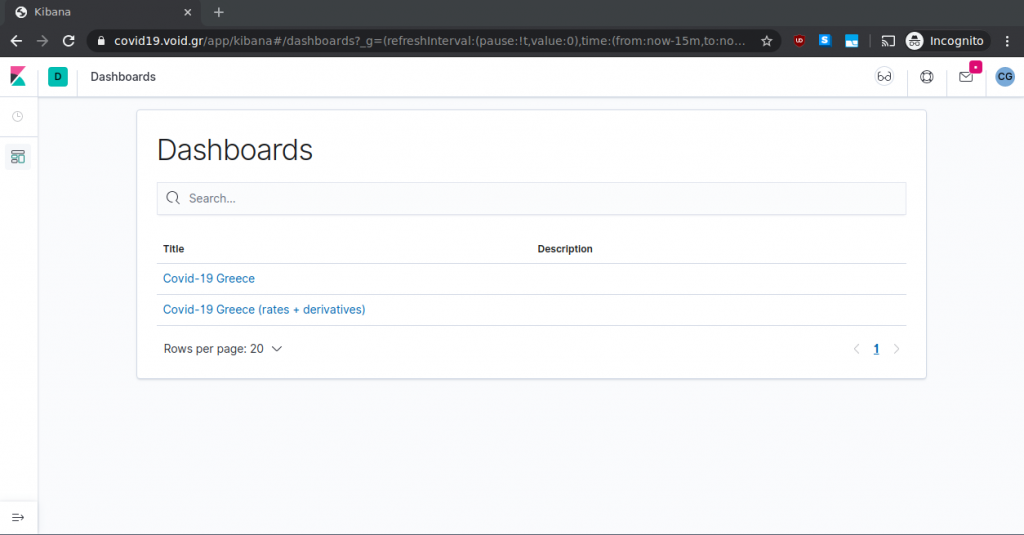
Allowing access to dashboards
As people took notice of the json files in the repo they started pinging me to create some visualizations from them. I created a Kibana readonly user and shared the password with a few of them. That worked well for a couple of days, but sharing a password for a readonly view is a bit meeeh. I wondered if I could create a password-less version of it and post the URL publicly. Publishing a URL in the form of https://abc123fe48752c2da3b19.eu-central-1.aws.cloud.es.io:9243 is not exactly memorable either. I googled if it’s possible to post credentials to Kibana, and indeed it is. So nginx to the rescue!
Reverse proxy to ESS
I first tried to use a URL within void.gr, eg void.gr/covid19 to point directly to Kibana hosted on ESS. Because of the various location rules already used in my void.gr nginx config this quickly became more complicated than it had to, so I created a new subdomain for it, covid19.void.gr. Here’s the reverse proxy config:
    location / {
      proxy_pass https://abc123fe48752997c2da3b19.eu-central-1.aws.cloud.es.io:9243;
      proxy_http_version 1.1;
      proxy_set_header Upgrade $http_upgrade;
      proxy_set_header Connection 'upgrade';
      proxy_set_header Host $proxy_host;
      proxy_cache_bypass $http_upgrade;
      proxy_set_header  X-Real-IP         $remote_addr; # pass on real client's IP
      proxy_set_header  X-Forwarded-For   $proxy_add_x_forwarded_for;
      proxy_set_header  X-Forwarded-Proto $scheme;
      auth_basic "Basic Auth";
      proxy_set_header Authorization "Basic bXl1c2VyOm15cGFzcw=="; # base64-encoded username:password to pass in header
      proxy_set_header x-forwarded-user $remote_user;
      proxy_hide_header kbn-license-sig;
      proxy_hide_header kbn-xpack-sig;
      proxy_hide_header kbn-name;
      proxy_hide_header x-found-handling-server;
      proxy_hide_header x-found-handling-instance;
      proxy_hide_header x-found-handling-cluster;
      proxy_hide_header x-cloud-request-id;
    }
Authorization header
Authentication is based on the base64 encoded output of username:password combination which is to be posted to Kibana. Create it via:
$ echo -n myuser:mypass | base64
bXl1c2VyOm15cGFzcw==
Adding these 2 config options is enough for nginx reverse proxy to authenticate to Kibana:
auth_basic "Basic Auth";
proxy_set_header Authorization "Basic bXl1c2VyOm15cGFzcw==";
Header removal
While not strictly necessary, I think it’s a good practice to remove non-essential headers being sent back to the browser via the reverse proxy.
End Result
One Let’s Encrypt certificate later and tada! https://covid19.void.gr is live!
Contribution
Do you want to contribute either by converting EODY’s reports to json or by improving the above visualizations dashboards ? leave a comment, send an email or ping me via twitter.
 Filed by kargig at 19:30 under General,Greek
Tags: covid-19, covid19, data, Elastic, EODY, ESS, Greece, TSVB, visualizations
No Comments | 12,576 views
