New traffic record for GRNET NOC streaming service

Around a year ago I wrote a blog post about how me and @zmousm scaled our streaming infrastructure at GRNET NOC so that we could cope with a sudden demand on the streaming service that we provide to the Greek Parliament. That setup was re-used again in January 2013 (Lagarde-list discussion) where we managed to surpass our previous record of 1.66Gbps reaching 1.79Gbps. We knew that the previous solution could definitely be improved though. Wowza does not seem to scale very well in our environment(*cough* java *cough*), so we modified our setup quite a bit.

What we did was take the original Wowza streamer, and ‘hide’ it behind two different categories of ‘proxy-servers’ that clients communicate with. The first category is made of three varnish proxies sitting at two different datacenters. All clients that fetch HTTP streams communicate only with the varnish proxies and not with the original streamer. Varnish uses very few resources and scales wonderfully. Then we added an nginx-rtmp server to offload RTMP clients from the original streamer. Now all RTMP clients communicate with nginx-rtmp only. We’ve also notified website owners that prefer using our RTMP stream to serve it through their own (flash) applications to switch to the nginx-rtmp endpoint. This means that the original Wowza streamer now mainly serves the three varnish proxies and the nginx-rtmp server as ‘clients’, and since the VM now has far less load, the stream it provides to the ‘proxy-servers’ doesn’t get ‘chopped’ from time to time, as it did previously when it served hundreds of clients.
While each wowza streamer previously needed 6Gb of RAM to serve around 500-600Mbit of traffic, varnish needs <1Gb and can easily serve 900Mbit. Our nginx-rtmp server also uses <1Gb of RAM. So we’re actually using fewer resources to serve more (happier) clients!

This setup gives us a lot of flexibility and extensibility. We can easily scale it horizontally when we want to just by adding more varnish or nginx-rtmp servers.

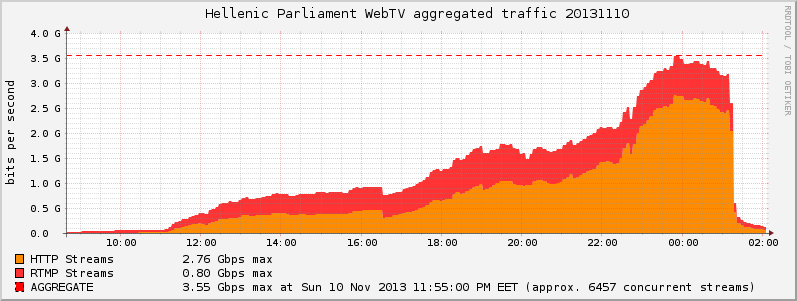
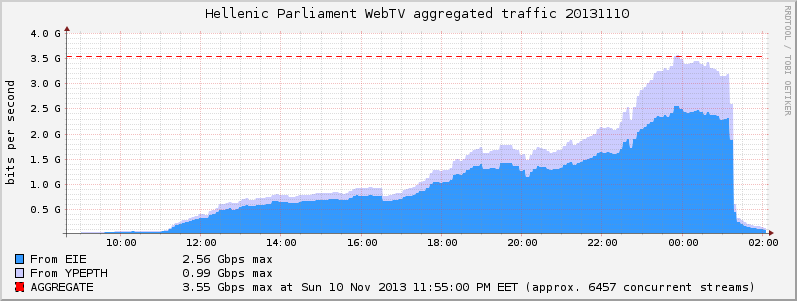
With this setup we were able to achieve 3.55Gbps and serve more than 6000 clients last Sunday (10/11/2013), that’s double of our previous record!

Here are the graphs:
traffic.parliament.20131110.type

traffic.parliament.20131110.dc

When in doubt, always blame the application

When you have a misbehaving system and you are not sure what the problem is, always bet on a poorly written application.

Here’s a small example of how another poorly written web application caused system issues.

I was sitting at my office today I when I got this nagios alert for a host.

Date/Time: Tue Nov 6 19:15:11 EET 2012
Additional Info:
SWAP CRITICAL – 0% free (0 MB out of 509 MB)

Logging in actually showed all the swap’s been used and so was RAM, 0.95/1Gb. Lots of apache2 server instances were running. I did a netstat and I saw a lot of ESTABLISHED connections:

tcp6       0      0 2001:DB8:f00::1:35571 2001:DB8:bar::100:80 ESTABLISHED 9631/apache2    
tcp6       0      0 2001:DB8:f00::1:35777 2001:DB8:bar::100:80 ESTABLISHED 9656/apache2    
tcp6       0      0 2001:DB8:f00::1:36531 2001:DB8:bar::100:80 ESTABLISHED 11578/apache2   
tcp6       0      0 2001:DB8:f00::1:36481 2001:DB8:bar::100:80 ESTABLISHED 11158/apache2   
tcp6       0      0 2001:DB8:f00::1:36295 2001:DB8:bar::100:80 ESTABLISHED 11115/apache2   
tcp6       0      0 2001:DB8:f00::1:34831 2001:DB8:bar::100:80 ESTABLISHED 8312/apache2  

2001:DB8:f00::1 -> my server
2001:DB8:bar::100 -> dst server

As one can easily see my server is connecting to port 80 of dst, possibly asking for something over HTTP.

# netstat -antpW | grep 2001:DB8:bar::100 | wc -l
111

# dig -x 2001:DB8:bar::100 +short                                 
crl.randomcertauthority.com.

tailing the log files didn’t show anything weird happening. I run a tcpdump for that dst server but there wasn’t at that time any traffic going on.

So, I took a look at munin to see when this problem started developing.


As it’s obvious from the above graphs, the problem started around 14:00. So I took another look at the apache logs and I saw a bot crawling a specific url from my server. I visited that url on my server using curl and I saw traffic flowing through tcpdump going from my server to dst server. So visiting that URL was definitely causing problems. But why?

I restarted apache, swap and memory were released, all the stale ESTABLISHED connections went away and I saw hundreds of FIN/RST packets going back and forth at tcpdump.

I tried to open a few concurrent connections from my PC to my server’s url using curl. After a couple of tries netstat showed that I had managed to create stale ESTABLISHED connections towards dst server. It was an HTTP connection asking for a crl. So I was both able to reproduce the problem and I also knew the specific url of the dst server that caused the connection hanging issues.
Next thing I did was to try to open direct HTTP connections from my server to the dst url using curl. After a few concurrent connections I managed to make curl hang. So the problem was definitely not on my server, but at the dst server.

Since it was already quite late, my first (re)action was to install mod_evasive to try and minimize the problem so I could take a better look the next day.

# aptitude install libapache2-mod-evasive
# a2enmod mod_evasive
### edit /etc/apache2/sites-enabled/site-name and add the following
       <IfModule mod_evasive20.c>
            DOSHashTableSize    3097
            DOSPageCount        1   
            DOSSiteCount        50  
            DOSPageInterval     1   
            DOSSiteInterval     1   
            DOSBlockingPeriod   10  
            DOSEmailNotify myemail@mydomain.gr
        </IfModule>
# /etc/init.d/apache2 reload

I tried to curl my server’s URL from my PC and I got blocked after the second concurrent try. But after some repetitions I was still able to create one or two stale ESTABLISHED connections from my server to the dst server. Far fewer than before but the problem was still somewhat reproducible.

Then I decided to take a look at the site’s PHP code. Finding the culprit was quite easy, I just had to find the code segment where PHP requested the dst server’s url.
Here’s the code segment:

$ch = curl_init($this->crl_url);
curl_setopt($ch, CURLOPT_RETURNTRANSFER,true);
$crl_content = curl_exec($ch);

The developer had never thought that the remove server might keep the connection open for whatever reason (rate limiting anyone?)

Patching it was quite simple:

$ch = curl_init($this->crl_url);
curl_setopt($ch, CURLOPT_RETURNTRANSFER,true);
curl_setopt($ch, CURLOPT_CONNECTTIMEOUT,'60');
curl_setopt($ch, CURLOPT_TIMEOUT,'60');
$crl_content = curl_exec($ch);

After this everything worked fine again. Connections were getting ESTABLISHED but after 60 seconds they got torn down, automagically. No more stale ESTABLISHED connections. Hooray!

A letter to every developer:

Dear developer,

please test your code before shipping. Pretty please take corner cases into account. We know you’re competent enough, don’t be lazy.

Your kind sysadmin