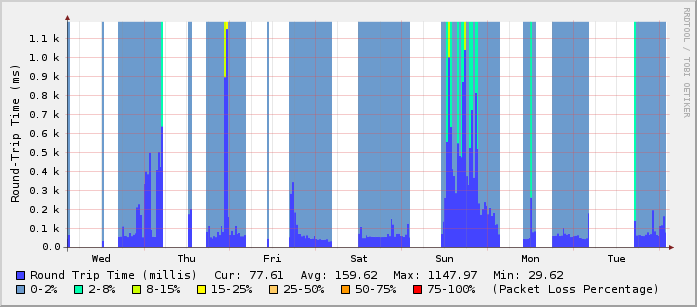
Round Trip and Packet Loss stats with rrdtool

To get some nice graphs showing your round trip time and your packet loss, like the following image, follow the steps below:

What you need before you start: rrdtool and a cron server (vixie-cron is fine).

a) Execute the following

/usr/bin/rrdtool create /var/rrds/ping/ping_wan.rrd \
--step 300 \
DS:pl:GAUGE:600:0:100 \
DS:rtt:GAUGE:600:0:10000000 \
RRA:AVERAGE:0.5:1:800 \
RRA:AVERAGE:0.5:6:800 \
RRA:AVERAGE:0.5:24:800 \
RRA:AVERAGE:0.5:288:800 \
RRA:MAX:0.5:1:800 \
RRA:MAX:0.5:6:800 \
RRA:MAX:0.5:24:800 \
RRA:MAX:0.5:288:800

You can change /var/rrds/ping/ping_wan.rrd to the path/file.rrd you wish.

b) Save the following to the file ping.sh

#!/bin/bash
PING=/bin/ping
COUNT=4
DEADLINE=10
ping_host() {
local output=$($PING -q -n -c $COUNT -w $DEADLINE $1 2>&1)
# notice $output is quoted to preserve newlines
local temp=$(echo "$output"| awk '
BEGIN {pl=100; rtt=0.1}
/packets transmitted/ {
match($0, /([0-9]+)% packet loss/, matchstr)
pl=matchstr[1]
}
/^rtt/ {
# looking for something like 0.562/0.566/0.571/0.024
match($4, /(.*)\/(.*)\/(.*)\/(.*)/, a)
rtt=a[2]
}
/unknown host/ {
# no output at all means network is probably down
pl=100
rtt=0.1
}
END {print pl ":" rtt}
')
RETURN_VALUE=$temp
}
# ping a host on the local lan
ping_host www.ntua.gr
/usr/bin/rrdtool update \
/var/rrds/ping/ping_wan.rrd \
--template \
pl:rtt \
N:$RETURN_VALUE

ping.sh.gz
Change the ping_host www.ntua.gr to the one of your choice. Make the script executable, chmod +x ping.sh.

If you have changed the /var/rrds/ping/ping_wan.rrd on step (a) you have to change it here too.

c) Save the following to ping-graph.sh and make it executable.

#!/bin/sh
cd /var/rrds/ping/
echo "
<HTML>
<HEAD><TITLE>Round-Trip and Packet Loss Stats</TITLE></HEAD>
<BODY>
<H3>Hourly Round-Trip & Packetloss Stats(1min average)</H3>
" > index.html
rrdtool graph ping_wan_hour.png -h 225 -w 600 -a PNG \
--imginfo '<IMG SRC=/stats/%s WIDTH=%lu HEIGHT=%lu >' \
--start -3600 --end -60 --x-grid MINUTE:10:HOUR:1:MINUTE:30:0:%R \
-v "Round-Trip Time (ms)" \
--rigid \
--lower-limit 0 \
DEF:roundtrip=ping_wan.rrd:rtt:AVERAGE \
DEF:packetloss=ping_wan.rrd:pl:AVERAGE \
CDEF:PLNone=packetloss,0,2,LIMIT,UN,UNKN,INF,IF \
CDEF:PL2=packetloss,2,8,LIMIT,UN,UNKN,INF,IF \
CDEF:PL15=packetloss,8,15,LIMIT,UN,UNKN,INF,IF \
CDEF:PL25=packetloss,15,25,LIMIT,UN,UNKN,INF,IF \
CDEF:PL50=packetloss,25,50,LIMIT,UN,UNKN,INF,IF \
CDEF:PL75=packetloss,50,75,LIMIT,UN,UNKN,INF,IF \
CDEF:PL100=packetloss,75,100,LIMIT,UN,UNKN,INF,IF \
AREA:roundtrip#4444ff:"Round Trip Time (millis)" \
GPRINT:roundtrip:LAST:"Cur\: %5.2lf" \
GPRINT:roundtrip:AVERAGE:"Avg\: %5.2lf" \
GPRINT:roundtrip:MAX:"Max\: %5.2lf" \
GPRINT:roundtrip:MIN:"Min\: %5.2lf\n" \
AREA:PLNone#6c9bcd:"0-2%":STACK \
AREA:PL2#00ffae:"2-8%":STACK \
AREA:PL15#ccff00:"8-15%":STACK \
AREA:PL25#ffff00:"15-25%":STACK \
AREA:PL50#ffcc66:"25-50%":STACK \
AREA:PL75#ff9900:"50-75%":STACK \
AREA:PL100#ff0000:"75-100%":STACK \
COMMENT:"(Packet Loss Percentage)"
echo "
<img src="ping_wan_hour.png"><br>
<br>
<H3>Daily Round-Trip & Packetloss Stats(1min average)</H3>
" >> index.html
rrdtool graph ping_wan_day.png -h 225 -w 600 -a PNG \
--imginfo '<IMG SRC=/stats/%s WIDTH=%lu HEIGHT=%lu >' \
--lazy --start -86400 --end -60 --x-grid MINUTE:30:HOUR:1:HOUR:2:0:%H \
-v "Round-Trip Time (ms)" \
--rigid \
--lower-limit 0 \
DEF:roundtrip=ping_wan.rrd:rtt:AVERAGE \
DEF:packetloss=ping_wan.rrd:pl:AVERAGE \
CDEF:PLNone=packetloss,0,2,LIMIT,UN,UNKN,INF,IF \
CDEF:PL2=packetloss,2,8,LIMIT,UN,UNKN,INF,IF \
CDEF:PL15=packetloss,8,15,LIMIT,UN,UNKN,INF,IF \
CDEF:PL25=packetloss,15,25,LIMIT,UN,UNKN,INF,IF \
CDEF:PL50=packetloss,25,50,LIMIT,UN,UNKN,INF,IF \
CDEF:PL75=packetloss,50,75,LIMIT,UN,UNKN,INF,IF \
CDEF:PL100=packetloss,75,100,LIMIT,UN,UNKN,INF,IF \
AREA:roundtrip#4444ff:"Round Trip Time (millis)" \
GPRINT:roundtrip:LAST:"Cur\: %5.2lf" \
GPRINT:roundtrip:AVERAGE:"Avg\: %5.2lf" \
GPRINT:roundtrip:MAX:"Max\: %5.2lf" \
GPRINT:roundtrip:MIN:"Min\: %5.2lf\n" \
AREA:PLNone#6c9bcd:"0-2%":STACK \
AREA:PL2#00ffae:"2-8%":STACK \
AREA:PL15#ccff00:"8-15%":STACK \
AREA:PL25#ffff00:"15-25%":STACK \
AREA:PL50#ffcc66:"25-50%":STACK \
AREA:PL75#ff9900:"50-75%":STACK \
AREA:PL100#ff0000:"75-100%":STACK \
COMMENT:"(Packet Loss Percentage)"
echo "
<img src="ping_wan_day.png"><br>
<br>
<H3>Weekly Round-Trip & Packetloss Stats(1min average)</H3>
" >> index.html
rrdtool graph ping_wan_week.png -h 225 -w 600 -a PNG \
--imginfo '<IMG SRC=/stats/%s WIDTH=%lu HEIGHT=%lu >' \
--lazy --start -604800 --end -1800 \
-v "Round-Trip Time (ms)" \
--rigid \
--lower-limit 0 \
DEF:roundtrip=ping_wan.rrd:rtt:AVERAGE \
DEF:packetloss=ping_wan.rrd:pl:AVERAGE \
CDEF:PLNone=packetloss,0,2,LIMIT,UN,UNKN,INF,IF \
CDEF:PL2=packetloss,2,8,LIMIT,UN,UNKN,INF,IF \
CDEF:PL15=packetloss,8,15,LIMIT,UN,UNKN,INF,IF \
CDEF:PL25=packetloss,15,25,LIMIT,UN,UNKN,INF,IF \
CDEF:PL50=packetloss,25,50,LIMIT,UN,UNKN,INF,IF \
CDEF:PL75=packetloss,50,75,LIMIT,UN,UNKN,INF,IF \
CDEF:PL100=packetloss,75,100,LIMIT,UN,UNKN,INF,IF \
AREA:roundtrip#4444ff:"Round Trip Time (millis)" \
GPRINT:roundtrip:LAST:"Cur\: %5.2lf" \
GPRINT:roundtrip:AVERAGE:"Avg\: %5.2lf" \
GPRINT:roundtrip:MAX:"Max\: %5.2lf" \
GPRINT:roundtrip:MIN:"Min\: %5.2lf\n" \
AREA:PLNone#6c9bcd:"0-2%":STACK \
AREA:PL2#00ffae:"2-8%":STACK \
AREA:PL15#ccff00:"8-15%":STACK \
AREA:PL25#ffff00:"15-25%":STACK \
AREA:PL50#ffcc66:"25-50%":STACK \
AREA:PL75#ff9900:"50-75%":STACK \
AREA:PL100#ff0000:"75-100%":STACK \
COMMENT:"(Packet Loss Percentage)"
echo "
<img src="ping_wan_week.png"><br>
<br>
<H3>Monthly Round-Trip & Packetloss Stats(1min average)</H3>
" >> index.html
rrdtool graph ping_wan_month.png -h 225 -w 600 -a PNG \
--imginfo '<IMG SRC=/stats/%s WIDTH=%lu HEIGHT=%lu >' \
--lazy --start -2592000 --end -7200 \
-v "Round-Trip Time (ms)" \
--rigid \
--lower-limit 0 \
DEF:roundtrip=ping_wan.rrd:rtt:AVERAGE \
DEF:packetloss=ping_wan.rrd:pl:AVERAGE \
CDEF:PLNone=packetloss,0,2,LIMIT,UN,UNKN,INF,IF \
CDEF:PL2=packetloss,2,8,LIMIT,UN,UNKN,INF,IF \
CDEF:PL15=packetloss,8,15,LIMIT,UN,UNKN,INF,IF \
CDEF:PL25=packetloss,15,25,LIMIT,UN,UNKN,INF,IF \
CDEF:PL50=packetloss,25,50,LIMIT,UN,UNKN,INF,IF \
CDEF:PL75=packetloss,50,75,LIMIT,UN,UNKN,INF,IF \
CDEF:PL100=packetloss,75,100,LIMIT,UN,UNKN,INF,IF \
AREA:roundtrip#4444ff:"Round Trip Time (millis)" \
GPRINT:roundtrip:LAST:"Cur\: %5.2lf" \
GPRINT:roundtrip:AVERAGE:"Avg\: %5.2lf" \
GPRINT:roundtrip:MAX:"Max\: %5.2lf" \
GPRINT:roundtrip:MIN:"Min\: %5.2lf\n" \
AREA:PLNone#6c9bcd:"0-2%":STACK \
AREA:PL2#00ffae:"2-8%":STACK \
AREA:PL15#ccff00:"8-15%":STACK \
AREA:PL25#ffff00:"15-25%":STACK \
AREA:PL50#ffcc66:"25-50%":STACK \
AREA:PL75#ff9900:"50-75%":STACK \
AREA:PL100#ff0000:"75-100%":STACK \
COMMENT:"(Packet Loss Percentage)"
echo "
<img src="ping_wan_month.png"><br>
<br>
<H3>Yearly Round-Trip & Packetloss Stats(1min average)</H3>
" >> index.html
rrdtool graph ping_wan_year.png \
--imginfo '<IMG SRC=/stats/%s WIDTH=%lu HEIGHT=%lu >' \
--lazy --start -31536000 --end -86400 -h 225 -w 600 -a PNG \
-v "Round-Trip Time (ms)" \
--rigid \
--lower-limit 0 \
DEF:roundtrip=ping_wan.rrd:rtt:AVERAGE \
DEF:packetloss=ping_wan.rrd:pl:AVERAGE \
CDEF:PLNone=packetloss,0,2,LIMIT,UN,UNKN,INF,IF \
CDEF:PL2=packetloss,2,8,LIMIT,UN,UNKN,INF,IF \
CDEF:PL15=packetloss,8,15,LIMIT,UN,UNKN,INF,IF \
CDEF:PL25=packetloss,15,25,LIMIT,UN,UNKN,INF,IF \
CDEF:PL50=packetloss,25,50,LIMIT,UN,UNKN,INF,IF \
CDEF:PL75=packetloss,50,75,LIMIT,UN,UNKN,INF,IF \
CDEF:PL100=packetloss,75,100,LIMIT,UN,UNKN,INF,IF \
AREA:roundtrip#4444ff:"Round Trip Time (millis)" \
GPRINT:roundtrip:LAST:"Cur\: %5.2lf" \
GPRINT:roundtrip:AVERAGE:"Avg\: %5.2lf" \
GPRINT:roundtrip:MAX:"Max\: %5.2lf" \
GPRINT:roundtrip:MIN:"Min\: %5.2lf\n" \
AREA:PLNone#6c9bcd:"0-2%":STACK \
AREA:PL2#00ffae:"2-8%":STACK \
AREA:PL15#ccff00:"8-15%":STACK \
AREA:PL25#ffff00:"15-25%":STACK \
AREA:PL50#ffcc66:"25-50%":STACK \
AREA:PL75#ff9900:"50-75%":STACK \
AREA:PL100#ff0000:"75-100%":STACK \
COMMENT:"(Packet Loss Percentage)"
echo "
<img src="ping_wan_year.png"><br>
<br>
</BODY>
</HTML>
" >> index.html

If you have changed /var/rrds/ping on step (a) you need to change it here in the beggining of the script too.

The above script creates a very simple index.html file inside /var/rrds/ping (unless you’ve changed it) with 5 graphs: hourly, daily, weekly, monthly and yearly

d) Add the following entries to your crontab:

*/5 * * * * /etc/mrtg/ping.sh
1,6,11,16,21,26,31,36,41,46,51,56 * * * * /path/to/ping-graph.sh

For better accuracy, you can change “–step 300” to “–step 60” in the rrd database creation script and then change the crontab entry for ping.sh from:
*/5 * * * * /etc/mrtg/ping.sh
to
* * * * * /etc/mrtg/ping.sh

Original ping script and rrd config for the graphs from http://haroon.sis.utoronto.ca/rrd/scripts/

Enjoy your graphs.

Vivodi Full LLU και Packet Filtering ?

Χθες προσπαθούσα να βοηθήσω κάποιον στο IRC να βάλει gentoo (δεν χρειάζονται σχόλια 😛 ). Είχε διαβάσει το gentoo handbook φτάσει στο σημείο που πρέπει να κατεβάσει το stage3 tarball (Παράγραφος 5a του handbook). Αρχίζει να κατεβάζει όλο χαρά το stage3 tarball από το mirror του ntua (http://ftp.ntua.gr/pub/linux/gentoo/releases/x86/current/stages/stage3-i686-2006.1.tar.bz2) και ξαφνικά κολλάει στο 72%. Το ξαναβάζει…τα ίδια. Δοκιμάζει με ftp αντί http….τα ίδια. Του δείχνω το wget -c ώστε να κάνει resume…τίποτα…δεν γινόταν resume. Του λέω ότι εγώ στο σπίτι μου το κατεβάζω κανονικά (Vivodi με γραμμή ΟΤΕ)…και του δίνω το mirror του uoi. Αρχίζει το download από την αρχή, στο 72% πάλι κόψιμο. Δοκιμάζει να κατεβάσει το αρχείο από windows ώστε να το περάσει μετά με usb flash στο gentoo, πάλι κόλλημα στο 72%. Δοκιμάζει mirror από την Γερμανία, τα ίδια…ενώ εγώ να το κατεβάζω κανονικότατα σε 2-3 διαφορετικές dsl. Του λέω δεν γίνεται…κάποιο δικτυακό πρόβλημα έχεις. Του ζητάω να μου ανοίξει ssh πάνω στο PC που θα γινόταν το install, δοκιμάζω και εγώ να το κατεβάσω…τίποτα…ούτε με links ούτε με wget, πάντα κόλλημα στο 72%. H κάρτα δικύου έπαιζε κανονικά…collisions, errors όλα μηδενικά.

Λέω…δεν γίνεται, το modem σου πρέπει να έχει πρόβλημα, κάποιο time-out γίνεται…δεν βγάζω άκρη. Τον ρωτάω αν έχει 2ο adsl modem, μου απαντάει θετικά και το αλλάζει κατευθείαν. Αρχίζει πάλι το download, στο 72% πάλι τα ίδια. Η κατάσταση ήταν πλέον για κλάμματα.
Τον ρωτάω τη σύνδεση έχει και μου απαντάει Vivodi Full LLU στην Πάτρα. Τον ρωτάω έπειτα αν έχει κανένα άλλο φίλο/γνωστό με full LLU στην Πάτρα και μου απαντάει θετικά. Βάζει το γνωστό του να κατεβάσει το ίδιο αρχείο…και ναι…κολλάει στο 72% !!!! Παράλληλα ο γνωστός του αυτός του αναφέρει πως ακούγεται πως η Vivodi έχει στήσει filtering σε κάποια σημεία του δικτύου της…
Η τελευταία ελπίδα ήταν να πειράξω το mirror του uoi ώστε να απαντάει και σε https ώστε τα πακέτα να είναι encrypted και να μην μπορούν να τα πιάσουν τα οποιαδήποτε φίλτρα. Δοκιμάζει να το κατεβάσει με https…και όντως δούλεψε! Πέρασε το 72% και ολοκληρώθηκε χωρίς κανένα πρόβλημα…

Το συμπέρασμα είναι πως σίγουρα το dslam της Vivodi στην Πάτρα είναι προβληματικό. Πολύ πιθανό η Vivodi να εφαρμόζει κάποιο packet filtering, και το συγκεκριμένο αρχείο στο “72%” να κάνει trigger ένα από τα filtra της vivodi και να γίνεται corrupt ύστερα. Εγώ δεν μπορώ να το εξηγήσω διαφορετικά. Αν κάποιος μπορεί και έχει μια άλλη εξήγηση…ευχαρίστως να την ακούσουμε…Αν επίσης κάποιος με full LLU από Vivodi έχει λίγο χρόνο ας δοκιμάσει να κατεβάσει το αρχείο:

http://ftp.uoi.gr/mirror/OS/gentoo/releases/x86/current/stages/stage3-i686-2006.1.tar.bz2

και να μας πει αν κολλάει στο 72%. Αν ναι ας πει και σε ποια πόλη/περιοχή μένει…μήπως και βγει κάποια άκρη…

Εννοείται πως σήμερα όταν ο άνθρωπος αυτός πήρε τηλέφωνο στην Vivodi να ρωτήσει πως και γιατί…δεν είχαν να του πουν τίποτα. Ποιος όμως θα τον αποζημιώσει για τις 4-5 και παραπάνω ώρες που έχασε και κόντεψαν να τον φέρουν σε κατάσταση υστερίας ?

Traffic shaping TorrentFlux

*Update on peers supporting encryption at the end of the post*

TorrentFlux is a great program/interface to download your torrents remotely on a linux machine. It is based on php and it uses a modified bittornado client to download the torrents.

The problem: The bittornado client is able to put specific limits on a per torrent basis. That means that you can put a 100kb/sec download and 50kb/sec upload limit per torrent through torrentflux’s web interface. If you have 20 torrents though, this easily becomes 20*50=1Mb/sec upload “limit”. There are cases that you don’t want this to happen and you want both a per torrent limit (eg 50kb/sec) and a global limit (eg 300kb/sec).

The solution: My solution is based on iptables, layer7 filter and tc (iproute2). I am using layer7 filter to pick out the bittorrent packets, iptables to mark those packets with specific values and tc to shape those marked packets into categories. Beware that the method I am using works mostly on the “uploading” part (outgoing traffic). It is not that hard to make it work for the incoming traffic as well, but it is my personal view that downloading with a few Mb/sec is not as harmfull as uploading with a few Mb/sec. I usually have my downloads seeded over many weeks…so it’s good for my ratio to have the torrent downloaded as fast as possible and then seed it endlessly. I usually like to seed until i get a ratio over 1000% per torrent (that means 10 times as much uploaded traffic than downloaded). The following example configs are created for use on a 100mbit line and keeping in mind that outgoing torrent traffic should not exceed 2-2.5Mbits (~250-300kb/sec).

The procedure:
0) Before you begin make sure you have the kernel sources on /usr/src/linux.

1) Then, you need to patch your kernel for layer7 filtering and enable marking. On gentoo linux you only need to:
#emerge -avt net-misc/l7-filter net-misc/l7-protocols
and then configure your kernel for marking.

Here’s how my netfilter configuration looks like:

CONFIG_NETFILTER=y
# CONFIG_NETFILTER_DEBUG is not set
# CONFIG_BRIDGE_NETFILTER is not set

#
# Core Netfilter Configuration
#
# CONFIG_NETFILTER_NETLINK is not set
CONFIG_NETFILTER_XTABLES=y
CONFIG_NETFILTER_XT_TARGET_CLASSIFY=m
# CONFIG_NETFILTER_XT_TARGET_CONNMARK is not set
CONFIG_NETFILTER_XT_TARGET_MARK=m
CONFIG_NETFILTER_XT_TARGET_NFQUEUE=m
CONFIG_NETFILTER_XT_MATCH_COMMENT=m
CONFIG_NETFILTER_XT_MATCH_CONNBYTES=m
CONFIG_NETFILTER_XT_MATCH_CONNMARK=m
CONFIG_NETFILTER_XT_MATCH_CONNTRACK=m
CONFIG_NETFILTER_XT_MATCH_DCCP=m
CONFIG_NETFILTER_XT_MATCH_ESP=m
CONFIG_NETFILTER_XT_MATCH_HELPER=m
CONFIG_NETFILTER_XT_MATCH_LENGTH=m
CONFIG_NETFILTER_XT_MATCH_LIMIT=m
CONFIG_NETFILTER_XT_MATCH_MAC=m
CONFIG_NETFILTER_XT_MATCH_MARK=m
# CONFIG_NETFILTER_XT_MATCH_POLICY is not set
CONFIG_NETFILTER_XT_MATCH_MULTIPORT=m
CONFIG_NETFILTER_XT_MATCH_PKTTYPE=m
# CONFIG_NETFILTER_XT_MATCH_QUOTA is not set
CONFIG_NETFILTER_XT_MATCH_REALM=m
CONFIG_NETFILTER_XT_MATCH_SCTP=m
CONFIG_NETFILTER_XT_MATCH_STATE=m
# CONFIG_NETFILTER_XT_MATCH_STATISTIC is not set
CONFIG_NETFILTER_XT_MATCH_STRING=m
CONFIG_NETFILTER_XT_MATCH_TCPMSS=m

#
# IP: Netfilter Configuration
#
CONFIG_IP_NF_CONNTRACK=m
CONFIG_IP_NF_CT_ACCT=y
CONFIG_IP_NF_CONNTRACK_MARK=y
# CONFIG_IP_NF_CONNTRACK_EVENTS is not set
CONFIG_IP_NF_CT_PROTO_SCTP=m
CONFIG_IP_NF_FTP=m
CONFIG_IP_NF_IRC=m
CONFIG_IP_NF_NETBIOS_NS=m
CONFIG_IP_NF_TFTP=m
CONFIG_IP_NF_AMANDA=m
CONFIG_IP_NF_PPTP=m
CONFIG_IP_NF_H323=m
CONFIG_IP_NF_SIP=m
CONFIG_IP_NF_QUEUE=m
CONFIG_IP_NF_IPTABLES=y
CONFIG_IP_NF_MATCH_IPRANGE=y
CONFIG_IP_NF_MATCH_LAYER7=m
# CONFIG_IP_NF_MATCH_LAYER7_DEBUG is not set
CONFIG_IP_NF_MATCH_TOS=y
CONFIG_IP_NF_MATCH_RECENT=m
CONFIG_IP_NF_MATCH_ECN=m
CONFIG_IP_NF_MATCH_DSCP=m
CONFIG_IP_NF_MATCH_AH=m
CONFIG_IP_NF_MATCH_TTL=m
CONFIG_IP_NF_MATCH_OWNER=m
CONFIG_IP_NF_MATCH_ADDRTYPE=m
CONFIG_IP_NF_MATCH_HASHLIMIT=m
CONFIG_IP_NF_FILTER=y
CONFIG_IP_NF_TARGET_REJECT=y
CONFIG_IP_NF_TARGET_LOG=y
CONFIG_IP_NF_TARGET_ULOG=m
CONFIG_IP_NF_TARGET_TCPMSS=y
CONFIG_IP_NF_NAT=m
CONFIG_IP_NF_NAT_NEEDED=y
CONFIG_IP_NF_TARGET_MASQUERADE=m
CONFIG_IP_NF_TARGET_REDIRECT=m
CONFIG_IP_NF_TARGET_NETMAP=m
CONFIG_IP_NF_TARGET_SAME=m
CONFIG_IP_NF_NAT_SNMP_BASIC=m
CONFIG_IP_NF_NAT_IRC=m
CONFIG_IP_NF_NAT_FTP=m
CONFIG_IP_NF_NAT_TFTP=m
CONFIG_IP_NF_NAT_AMANDA=m
CONFIG_IP_NF_NAT_PPTP=m
CONFIG_IP_NF_NAT_H323=m
CONFIG_IP_NF_NAT_SIP=m
CONFIG_IP_NF_MANGLE=m
CONFIG_IP_NF_TARGET_TOS=m
CONFIG_IP_NF_TARGET_ECN=m
CONFIG_IP_NF_TARGET_DSCP=m
CONFIG_IP_NF_TARGET_TTL=m
CONFIG_IP_NF_TARGET_CLUSTERIP=m
# CONFIG_IP_NF_RAW is not set
CONFIG_IP_NF_ARPTABLES=m
CONFIG_IP_NF_ARPFILTER=m
CONFIG_IP_NF_ARP_MANGLE=m

You can clearly see layer7 being enabled as a module: CONFIG_IP_NF_MATCH_LAYER7=m
Rebuild your kernel and install the proper modules. If you need to reboot your machine to apply the new kernel do it now.

2) Now it’s time to install iptables and iproute2 if you don’t have them already. On gentoo linux:

#echo "net-firewall/iptables extensions l7filter" >> /etc/portage/package.use
#emerge -avt net-firewall/iptables sys-apps/iproute2

3) Now it’s the iptables marking time. I am going to show you (some of) the output of my iptables-save command. Change it to fit your neeeds:

# Generated by iptables-save v1.3.5 on Fri Jan 12 20:50:52 2007
*mangle
:PREROUTING ACCEPT [1102387:193393325]
:INPUT ACCEPT [1102372:193390208]
:FORWARD ACCEPT [0:0]
:OUTPUT ACCEPT [2100485:2922693566]
:POSTROUTING ACCEPT [2100483:2922690566]
-A PREROUTING -s IP.OF.MACHINE -p tcp -m multiport --sports 22,80 -j MARK --set-mark 1001
-A PREROUTING -d IP.OF.MACHINE -p tcp -m multiport --dports 22,80 -j MARK --set-mark 1001
-A PREROUTING -m layer7 --l7proto ssh -j MARK --set-mark 1001
#-A PREROUTING -m layer7 --l7proto bittorrent -j MARK --set-mark 11090
-A PREROUTING -m mark --mark 1001 -j RETURN
-A POSTROUTING -s IP.OF.MACHINE -p tcp -m multiport --sports 22,80 -j MARK --set-mark 1001
-A POSTROUTING -d IP.OF.MACHINE -p tcp -m multiport --dports 22,80 -j MARK --set-mark 1001
-A POSTROUTING -m mark --mark 1001 -j RETURN
-A POSTROUTING -m connmark --mark 0x0 -j MARK --set-mark 11030
-A POSTROUTING -m layer7 --l7proto dns -j MARK --set-mark 11010
-A POSTROUTING -m layer7 --l7proto ssh -j MARK --set-mark 11010
-A POSTROUTING -p tcp -m tcp --tcp-flags SYN,RST,ACK SYN -j MARK --set-mark 11010
-A POSTROUTING -p icmp -j MARK --set-mark 11010
-A POSTROUTING -m layer7 --l7proto bittorrent -j MARK --set-mark 11090
COMMIT
# Completed on Fri Jan 12 20:50:52 2007
# Generated by iptables-save v1.3.5 on Fri Jan 12 20:50:52 2007
*nat
:PREROUTING ACCEPT [407:30699]
:POSTROUTING ACCEPT [111:6662]
:OUTPUT ACCEPT [111:6662]
COMMIT
# Completed on Fri Jan 12 20:50:52 2007
# Generated by iptables-save v1.3.5 on Fri Jan 12 20:50:52 2007
*filter
:INPUT ACCEPT [266369:32040284]
:FORWARD ACCEPT [0:0]
:OUTPUT ACCEPT [479227:676859047]
COMMIT
# Completed on Fri Jan 12 20:50:52 2007

You need to change IP.OF.MACHINE with the IP of your linux box.

4) And now the traffic shaping part:

# Main Link
LINK=100000
SHAPEDLINK=50000
# High Priority
HIGHPRIO=10000
HIGHPRIO_MAX=$SHAPEDLINK
# Normal
NORMAL=512
NORMAL_MAX=$SHAPEDLINK
# Downloads
TOR=512
TOR_MAX=2048
# del old
tc qdisc del dev $DEV root 2> /dev/null > /dev/null
# add root
tc qdisc add dev $DEV root handle 100: htb default 1
tc class add dev $DEV parent 100: classid 100:1 htb rate ${LINK}kbit
tc qdisc add dev $DEV parent 100:1 handle 1: htb
tc class add dev $DEV parent 1: classid 1:1 htb rate ${SHAPEDLINK}kbit
# some more rules
tc class add dev $DEV parent 100: classid 100:1 htb rate ${LINK}kbit
tc qdisc add dev $DEV parent 100:1 sfq perturb 10
tc filter add dev $DEV parent 100:0 protocol ip prio 1 handle 1001 fw flowid 100:1
tc class add dev $DEV parent 1:1 classid 1:10 htb rate ${SHAPEDLINK}kbit ceil ${SHAPEDLINK}kbit prio 5
tc qdisc add dev $DEV parent 1:10 sfq perturb 10
# High priority
tc class add dev $DEV parent 1:10 classid 1:1010 htb rate ${HIGHPRIO}kbit ceil ${HIGHPRIO_MAX}kbit prio 0
tc qdisc add dev $DEV parent 1:1010 sfq perturb 10
tc filter add dev $DEV parent 1:0 protocol ip prio 0 handle 11010 fw flowid 1:1010
# normal
tc class add dev $DEV parent 1:10 classid 1:1030 htb rate ${NORMAL}kbit ceil ${NORMAL_MAX}kbit prio 5
tc qdisc add dev $DEV parent 1:1030 sfq perturb 10
tc filter add dev $DEV parent 1:0 protocol ip prio 5 handle 11030 fw flowid 1:1030
# bittorent
tc class add dev $DEV parent 1:10 classid 1:1090 htb rate ${TOR}kbit ceil ${TOR_MAX}kbit prio 10
tc qdisc add dev $DEV parent 1:1090 sfq perturb 10
tc filter add dev $DEV parent 1:0 protocol ip prio 10 handle 11090 fw flowid 1:1090

The rules are pretty straightforward…so I am not going to fully explain them. The basic concept is that you create a “shaped” partition of your bandwith and you add classes (high priority, normal , bittorrent) there. The trick is that you can skip anything you don’t want shaped by marking it with iptables 1001 mark.

In my iptables example above, I mark as 1001 the outgoing ssh and http traffic. This way I can shape the seeding of my torrents using TorrentFlux but I can download via http without any traffic shaping the torrents to my PC at home. I can also ssh to the machine without any latency caused by the shaping because the sshd port (22) is marked with 1001.

The only problem I faced with those scripts was that sometimes the layer7 filter for bittorrent let’s some torrent traffic pass by. My solution to that was to change NORMAL_MAX=$SHAPEDLINK to NORMAL_MAX=2048 for example. Then, even “normal traffic” was shaped. Remember that anything I didn’t want shaped, was marked as 1001 on the iptables script…so the machine was still very responsive even after shaping the “normal traffic”.

To check how your scripts are doing in terms of shaping you can download this excellent perl script: tc-viewer. Click here for a screenshot: tc-viewer htb screenshot

The above example configs are very very generic. If you have a server that serves many other duties apart from ssh, http and bittorrent, then this script might not work out of the box for you.

*Update*
It looks like the problem I had with layer7 bittorrent filter missing packets was not actually a layer7’s “problem”, but rather a new feature of the latest version of bittornado. I was using bittornado version 0.3.18 (experimental) which is the first bittornado version that comes with Message_Stream_Encryption. What this means: whenever bittornado finds another peer with encryption capabilities, it encrypts all traffic between you and the other peer, so the layer7 filter cannot understand that these flows are torrent traffic anymore, and categorizes them as “normal” traffic. That’s why I needed to “shape” normal traffic as well.
There are three ways to cope with encrypted bittorrent traffic. The first one is the one I described above without even knowing about it (shaping normal traffic). The second way is to go back to a version without encryption (0.3.17), which I think is a _really_ bad idea. Encryption came to help us hide our traffic from ISP filters, and is a step we can all take to protect ourselves. The third way is to mark the port range that torrentflux uses (check the admin panel of torrentflux for it) as torrent traffic by our iptables script. If the port range is high enough it can be almost certain that no other service will use those ports, so no priority traffic will be mis-matched as “torrent traffic”. If, for example, you have defined your port range to be from port 61000 to port 63000, then inject a command like:
-A POSTROUTING -p tcp --sport 61000:63000 -j MARK --set-mark 11090
just below the
-A POSTROUTING -m layer7 --l7proto bittorrent -j MARK --set-mark 11090
command of the iptables script above.

Enjoy shaped encrypted bittorent uploads! Keep seeding…

Ευρωπαικά Ερευνητικά Δίκτυα

Στα πλαίσια της τελευταίας εκδήλωσης του ΕΔΕΤ Grnet Tech Event o κ. Μάγκλαρης, πρόεδρος του NREN-PC έδωσε μια ομιλία για τα ευρωπαικά ερευνητικά δίκτυα, μέλος των οποίων είναι το ΕΔΕΤ. Εξηγεί αρκετά καλά την ιστορία των δικτύων στην Ευρώπη καθώς και ποιες είναι οι τάσεις αυτό το καιρό (10-40-100Gbit, dark fiber, virtual open source routers, κτλ).

Δείτε το Video για να καταλάβετε τον νέο “ψηφιακό πόλεμο” και το “ψηφιακό χάσμα” στην “δημοκρατική Ευρώπη”.

dynamic hostname updates with DHCPd + BIND

The following text describes the way to make DHCPd create DNS records of dhcp clients. This scenario is usually called a DDNS server.

We will first setup up BIND and then DHCPd.
1) We need to create a “key”. A key is a password that allows dhcpd to update bind… imagine something like an authentication scheme. In order to create such a key file to the following:
# rndc-confgen -a
A key file will be created. On Gentoo Linux this file is put inside /etc/bind/ and is called “rndc.key”.
Now open up your named.conf file and put these line inside:
include "/etc/bind/rndc.key";
controls {
inet 127.0.0.1 allow { localhost; } keys { rndc-key; };
};

If you already have a controls section just modify it to include the keys { } directive.

Now, in your zones that you want to be dynamically updated modify them to look like this:

zone "0.168.192.in-addr.arpa" {
type master;
file "pri/192.168.0.zone";
allow-update { key "rndc-key"; };
notify yes;
};
zone "home-sweet-home.gr" {
type master;
file "pri/home-sweet-home.gr.zone";
allow-update { key "rndc-key"; };
notify yes;
};

The “allow-update” is the crucial part here.
If you’ve done that changes we are finished from the BIND configuration. Restart the service and you are done.

2)Time for DHCPd configuration.
Remember your rndc-key file ? Open it and paste it contents inside your dhcpd.conf file so it looks a bit like this:
key "rndc-key" {
algorithm hmac-md5;
secret "goa6aw7a9WwapCyai0naZQ==";
};

Among others you have to put the zone files that you want to be updated. Following my previous zone declaration in named.conf and supposing that the primary nameserver is 192.168.0.50, that should be:

zone home-sweet-home.gr {
primary 192.168.0.50;
key rndc-key;
}
zone 0.168.192.in-addr.arpa. {
primary 192.168.0.50;
key rndc-key;
}

Now some generic configuration stuff to allow dynamic dns updates:

ddns-update-style interim;
ddns-domainname "home-sweet-home.gr.";
use-host-decl-names on;
allow client-updates;
option oe-key code 159 = string;
option oe-gateway code 160 = ip-address;
on commit {
if (not static and
((config-option server.ddns-updates = null) or
(config-option server.ddns-updates != 0))) {
if exists oe-key {
set ddns-rev-name =
concat (binary-to-ascii (10, 8, ".",
reverse (1, leased-address)), ".",
pick (config-option server.ddns-rev-domainname,
"in-addr.arpa."));
set full-oe-key = option oe-key;
switch (ns-update (delete (IN, 25, ddns-rev-name, null),
add (IN, 25, ddns-rev-name, full-oe-key,
lease-time / 2)))
{
default:
unset ddns-rev-name;
break;
case NOERROR:
on release or expiry {
switch (ns-update (delete (IN, 25, ddns-rev-name, null))) {
case NOERROR:
unset ddns-rev-name;
break;
}
}
}
}
}
}

(weird huh ? Nope that’s not mine … I just copied it from someplace on the web)

I will now show you my subnet configuration. Change it to fit your needs:

subnet 192.168.0.1 netmask 255.255.255.0 {
range 192.168.0.100 192.168.0.200;
option domain-name-servers 192.168.0.50;
option domain-name "home-sweet-home.gr";
option routers 192.168.0.10;
default-lease-time 600;
max-lease-time 7200;
update-static-leases on;
host PC1 {
hardware ethernet 00:12:34:56:78:ab;
fixed-address 192.168.0.21;
option host-name "PC1";
DDNS-hostname "PC1";
}
}

With this configuration, all clients on the subnet will be given IP addresses in the range 192.168.0.100 – 192.168.0.200, except from the PC with MAC address 00:12:34:56:78:ab that will be given IP 192.168.0.21. The ” update-static-leases on;” is very important for PC1. Unless it is defined no updates to DNS records would be created for it.

Now restart DHCPd, make a client DHCP request and check your log file (/var/log/messages probably) for the results.

You can read more about the ddns server subject at the following places:
http://kristijan.org/?q=node/69
http://alex.kruijff.org/FreeBSD/Dynamic_DNS.html
http://www.ops.ietf.org/dns/dynupd/secure-ddns-howto.html
http://www.southwestern.edu/pipermail/netreg/2005-October/001074.html

It’s quite usefull if you have a need for it 🙂

Netroute firmware 577

After asking some people, I have finally decided to post netroute’s firmware version 577 on my blog.

I hope I won’t be forced to remove it any time soon…so here it is: netroute-firmware-577.tar.gz

I won’t publish any update instructions. You are on your own…I don’t want to be held responsible if you bork your router…

Guli LiveCD

It’s been a while now, since May 2006, that me and some others from the local Ioannina LUG are trying to create a new livecd, the Guli LiveCD. This livecd is geared mostly towards students, scientists and developers. It’s geared towards us…it’s something that will make our lives easier while travelling or while visiting a friend or … or … or …

It is Gentoo based, severy influenced by DSL (damn small linux) as well as other minimalistic livecds, but it’s size has grown to a full CD due to the hundreds of applications we wanted to add. There is of course X windows support, with fluxbox as a window manager, but it is not started by default, yet.

There are a few main categories of applications:

  • Networking
  • There are a lot of networking tools inside this livecd what will help you identify and correct problems inside your network. These include scanners, packet sniffers, tunneling software, and so on…

  • Scientific
  • Scientific applications were included in order for some of us to be able to travel and still have a way to implement a new idea that strikes us. The main interest so far is Chemistry, Mathematics and Physics. Full tex/latex support is included.

  • Developing
  • Since many of the ILUG members are students of the Computer Science department it was inevitable that many development tools would be included. There is support for many languages (C, fortran, Java, Haskell, prolog, php, python, perl, ruby,etc), with their compilers and debuggers. The full man pages are also kept so that they serve as a reference for those who want them.

  • Disaster recovery
  • Last but not least we have included a lot of tools that could salvage your system in case of an emergency. These are file recovery tools, password reset tools (even for windows) and lots of others.

    There are of course applications like firefox, sylpheed, abiword, gnucalc, gaim, skype, etc included on Guli for everyday tasks.

    The total number of executables on this LiveCD is quite large, a double tab pressing on the console will give you something like this:
    Display all 3355 possibilities? (y or n)

    And there are more to come…

    The current version was released yesterday and it is an anniversary edition for ILUG’s 1 year of existence. You can find more information, full list of packages and the download link about this live cd at ILUG’s forums (currently only in Greek, until Guli gets a proper website).

    This liveCD is not geared towards new users who want to see a fancy livecd with XGL and stuff like that. People who have never before used linux might find it a bit diffucult to navigate through the livecd.

    We would appreciate any comments/bugs either on the forum or on the bug tracker

    Netroute2 stats with rrdtool

    On my previous port about netroute2 I said that it was really easy to grab some stats with mrtg about line activity. This has a small drawback, you must have your collector/server that will run mrtg always open so that it can constantly get the snmp statistics from the modem/router. So my quest was to figure out a way to keep the statistics on the modem and be able to get them when I want and create the graphs that I like. This is not something mrtg can do, this is an rrdtool job 🙂

    Most things said here are based on my previous post about netroute2: Intracom netroute2 hacks. You will definitely need to have read it before continuing…

    Tweaking the Netroute2:
    The first thing was to create a script to give me information about incoming and outgoing traffic on ppp0 interface. I also to export these stats on a file “parsable” by rrdtool. The following script does exactly that:


    #!/bin/sh
    ifconfig="/sbin/ifconfig"
    grep="/bin/grep"
    date="/bin/date"
    cut="/usr/bin/cut"
    tail="/usr/bin/tail"
    delim=":"
    OUTPUT="/tmp/var/for_rrd.log"
    RX=`$ifconfig ppp0 | $grep -A 6 ppp0 | $tail -n 1 | $cut -d":" -f2 | $cut -d" " -f1`
    TX=`$ifconfig ppp0 | $grep -A 6 ppp0 | $tail -n 1 | $cut -d":" -f3 | $cut -d" " -f1`
    echo `$date +%s`"$delim$RX$delim$TX" >> $OUTPUT

    What this script does is parse the output of ifconfig ppp0, find the number of bytes for incoming and outgoing and store them to /tmp/var/for_rrd.log. Remember that netroute2 has /tmp writable, so we can use/abuse it 🙂
    The output of the script is something like this:

    TIMESTAMP:OUTGOING:INCOMING

    1160651881:7938452:1310405

    So now we can have the stats stored someplace. It’s time to tell netroute2’s cron to do it every X minutes.

    # cat /etc/cron.d/cron_rrdscript
    */1 * * * * root /etc/rrdscript.sh > /dev/null 2>&1

    Now, every 1 minute our log is going to be filled with our traffic. You did remember to run /etc/init.d/checkpoint … didn’t you ? If you don’t know why you should do it…DON’T continue reading on!!! Go back and read this: Intracom netroute2 hacks

    RRDTool time now…
    I suppose you have already installed rrdtool on your favorite distro somehow (emerge,apt-get,rpm,blahblahblah). First thing we need to do is create an rrd database to keep our stats. Save the following in create_netroute2_rate.txt

    rrdtool create netroute_rate.rrd --start 1159455804 \
    DS:IN:COUNTER:600:0:12500000 \
    DS:OUT:COUNTER:600:0:12500000 \
    --step 60 \
    RRA:AVERAGE:0.5:1:2000 \
    RRA:AVERAGE:0.5:6:2000 \
    RRA:AVERAGE:0.5:24:2000 \
    RRA:AVERAGE:0.5:288:2000 \
    RRA:MAX:0.5:1:2000 \
    RRA:MAX:0.5:6:2000 \
    RRA:MAX:0.5:24:2000 \
    RRA:MAX:0.5:288:2000

    BIG FAT WARNING!! You HAVE to change the timestamp –start 1159455804 with the current timestamp if you want to get accurate stats. 1159455804 was when I started getting my stats. You MUST change this with your current one. The command “date +%s” is your friend in this…

    Now execute sth like this: “/bin/sh create_netroute2_rate.txt”. You should have a beautiful netroute_rate.rrd file inside your current dir. Time to fill up this database with information from the file “for_rrd.log”.
    If you don’t have yet public key authentication with your netroute2, now is the crucial time to do it. Paragraph F) of my previous post (Intracom netroute2 hacks) is exactly that.

    (timelapse)

    I am supposing you already did it…To check if it’s working issue something like this:
    ssh -l root -p 22 PUT.IP.OF.NETROUTE2.HERE uname -a
    Hopefully you’ll get prompted with something like: “Linux netroute- 2.4.30-netta2 #2 Tue Mar 21 10:51:17 EET 2006 ppc unknown”. If not check again what went wrong…

    Now a command like the following will grab “for_rrd.log” from netroute2 and put it in /var/rrds/ (that’s the dir I am using to store my rrd databases, logs, scripts, etc)
    scp root@PUT.IP.OF.NETROUTE2.HERE:/tmp/var/for_rrd.log /var/rrds/for_rrd.log

    Now..parsing time! This is my netroute-rrd.sh:

    #!/bin/sh
    cd /var/rrds/
    NEWFILE="for_rrd.log"
    OLDFILE="for_rrd.log.old"
    if [ ! -f $NEWFILE ]; then
    echo "No new file found"
    exit 1
    fi
    diff $OLDFILE $NEWFILE | grep -v "," | sed 's/^>[ \t]\+//' > to_parse
    cat to_parse |while read line;
    do
    echo "${line}";
    rrdtool update netroute_rate.rrd $line
    echo "$?"
    done
    rm -f to_parse
    mv for_rrd.log for_rrd.log.old

    If you execute this script it will compare this script with the older one you had downloaded, diff them and parse the output with rrdtool. I do that to ensure that rrdtool only parses what was not parsed before. It’s really stupid to parse the log file everytime from the beggining…

    Now you have your database filled up with values…so what ? how can you see the results ? With a script that takes advantage of rrdgraph 🙂 This script is quite big, more than 150lines so I will not copy/paste it here but I will provide you with a tarball of it and all the previously mentioned scripts ment to be stored on your box.
    Netroute2 RRDTool Scripts

    Combine all these together with a cron job from your pc like the following:
    */5 * * * * scp root@PUT.IP.OF.NETROUTE2.HERE:/tmp/var/for_rrd.log /var/rrds/for_rrd.log ; /etc/scripts/netroute-rrd.sh; /etc/scripts/netroute-rrd-graph.sh

    and you will have a /var/rrds/index.html with 5 graphs: Hourly, Daily, Weekly, Monthly and Yearly.

    Now you can monitor your Internet traffic even when your stats collector is offline.
    There is a chance that you will get some spikes when netroute2 reboots. To eliminate them read this: HOWTO remove spikes from RRD graphs

    If you are greek and want to know some more stuff about rrdtool there’s a tutorial here: RRD [HOWTO]

    Intracom netroute2 hacks

    Since I now own my own dsl I am using an intracom netroute2 as a dsl modem/router. What really rocks about it is that it is linux (busybox) based, so one can change a lot of how stuff works in it. The bad news about it is that Intracom no longer produces it! The good news is that someone might be able to get some second hand of those modems really cheap. I wonder who was the idiot to stop the production of those modems in Intracom…

    Anyway…I’ll post here some of the changes I did to it . I am using firmware version 577 so everything I say here might not work on older ones.

    A) Fix ntp.
    The modem/router on boot reads /etc/date and changes the date according to that file. My version dated from april 2006 made the modem on boot to think that it was april. It is easy to fix this using an ntpclient cronjob. So create a file inside /etc/cron.d/ named cron_ntpclient and paste the following inside it:
    0,15,30,45 * * * * root /usr/bin/ntpclient -s -h ntp.grnet.gr > /dev/null 2>&1
    This will sync the time on the modem every 15minutes.
    If you want to be even more accurate like I do check out the following. I had noticed that my modem takes about 1 min and 20 secs from the time I plugged it in till the time it got IP from my ISP. So if I could make it to ntp sync immediately after getting an IP it would be pretty cool. So, I edited /etc/date and replaced the contents of the file with the following:
    091918002006
    This makes the modem to set its date at 18:00 19-September-2006.

    Then change the cron script to this:
    02,15,30,45 * * * * root /usr/bin/ntpclient -s -h ntp.grnet.gr > /dev/null 2>&1

    Now the modem syncs the date on the next minute after it gets IP from the ISP. This is really helpfull if you use syslog (read on for this).

    BEWARE though that BEFORE you reboot you MUST run /etc/init.d/checkpoint. This command is VITAL! It saves the changes you do inside the configuration files so they are not overwritten on the reboot by the stuff inside /etc-ro/.

    B) This version has snmpd installed but not started by default. So let’s make it start when netroute2 boots.
    The only thing that needs to be done for this is add an entry inside /etc/net.conf. You need to add somewhere around the end an entry like this:

    SNMP_RO_COMMUNITY=YOUR_SNMP_COMMUNITY

    Change ‘YOUR_SNMP_COMMUNITY’ with a password of your choice. You can use vi to do it. Run /etc/init.d/checkpoint afterwards to save your changes.

    You can now reboot Netroute2 and if you type ‘ps aux’ on it’s shell you will probably see something like this:
    408 root 840 S /sbin/snmpd -c /etc/snmpd.conf -l /dev/null
    That means snmpd is now listening for connections. You can now monitor the traffic with mrtg if you want from another PC. I’ll post my own mrtg.conf for the netroute2 but it does not necessarily mean that it will work for you too. It depends on which ethernet devices you use to connect it to your network. I use eth0.
    Here’s the mrtg.conf for my netroute2: netroute2-mrtg.conf

    Use it with your other mrtg scripts, I won’t tell you how here…if you don’t know…google for it. It’s realy simple. Here’s a HOWTO from the Gentoo Wiki HOWTO_SNMP_and_MRTG_Made_Easy for the lazy ones.

    C) Syslog activation.
    A syslog daemon is also included but not started in netroute2. It is primarily thought to be logging remotely to another machine. But netroute2 has 10Mb of free space at /tmp…so we can make it store some logs there. On reboot these logs are lost, so it’s only usefull if you netroute is on a UPS or if you want to monitor what’s going on while netroute is working. It’s not for watching what happened and your netroute2 crashed. If you want such behaviour you must activate remote syslog logging, and if you want that you must be able to easily find out how to do it, you don’t need my advice 🙂

    First of all fire up vi and edit /etc/syslog.conf. Change all entries that start with /var/log to /tmp/var/log/. Then go find /etc/init.d/rc-syslog and edit it with vi. Find line 13. It should say something like this:

    /bin/echo "Invalid Syslog Server IP!"
    exit 1

    Change it to:

    /bin/echo "Invalid Syslog Server IP!"
    /bin/echo "Logging Locally!"
    mkdir -p /tmp/var/log/
    #exit 1

    What happens here is this, the script searches /etc/net.conf for a variable named SYSLOG_SERVER_IP. If it finds it it enables remote syslogging to that IP (damn!.. I’ve said it), but we want to enable local logging so we have to bypass it. We first create the /tmp/var/log directory and then put a “#” in front of the exit command so the script does not stop when it can’t find SYSLOG_SERVER_IP.

    /etc/init.d/checkpoint again….reboot…and if all went fine if you “ps aux” you should see something like:

    166 root 336 S /sbin/syslogd
    169 root 264 S /sbin/klogd -c 3 -x

    If you cd to /tmp/var/log you can find the log files. You can more them, tail them, grep them, whatever…it’s up to you now.

    D) Enable iptables logging.
    Netroute2 features iptables firewalling and tc for QoS!!! You can easily modify the firewall script to make it suit your needs better. What I am going to describe here is how to make iptables log to syslog so you can view what is being blocked by iptables.

    First thing you have to do is go to the web interface (yes it IS sloooooooow but who cares ? You won’t be needing much anyway 🙂 ), go to “Wan Connections” and click on Firewall. Go where it says “Expert Configuration” (don’t you already feel l33t ? heh) and add a dummy line like this:

    iptables -A INPUT -i ppp0 -p tcp --dport 135 -j DROP

    Click on apply and wait a bit until it refreshes the firewall webpage.
    This line, even it is totally useless (if you know a bit of iptables and see the rest of the firewall listing I am sure you already know why), it will force netroute2 to create a seperate firewall file for your connection and not use its default one.

    Now go back to netroute2's shell. If you don't know/remember the name of your connection do an
    ls /etc/wan/current/
    and it will show you it's name. Then go to /etc/wan/firewall/ and edit the file with your connection name. You will see inside it the full listing of iptables rules.

    Lines 25-27 should a bit like these:

    :INPUT ACCEPT [0:0]
    :FORWARD ACCEPT [43:9993]
    :OUTPUT ACCEPT [73:33579]

    Add below the last one a line like the following:

    :LOG_DROP - [0:0]

    Around line 65 there should be something like this:

    -A INPUT -i ppp0 -j DROP

    change it to:

    -A INPUT -i ppp0 -j LOG_DROP

    Then finally find the last line of the file that says COMMIT and add above it these two lines:

    -A LOG_DROP -j LOG
    -A LOG_DROP -j DROP

    The editing is finished. DON’T forget to /etc/init.d/checkpoint….reboot and you are ready.

    If you had previously enabled syslog logging correctly you can do a:
    tail -f /tmp/var/log/kernel.log

    and if you firewall blocks something you might see a line that looks like this:
    Sep 24 02:16:57 (none) kernel: IN=ppp0 OUT= MAC= SRC=XX.XX.XX.XX DST=YY.YY.YY.YY LEN=48 TOS=0x00 PREC=0x00 TTL=128 ID=30976 DF PROTO=TCP SPT=3935 DPT=135 WINDOW=65535 RES=0x00 SYN URGP=0

    You can change all the other “-j DROP” settings inside your firewall config with “-j LOG_DROP” to gather more information about what gets dropped. If you do that though it might be necessary to refine your /etc/syslog.conf to create more accurate log files..Which log files keeps what kinds of logs…play with it.

    E) Netroute has some advanced commands that are not inside the PATH.
    Look for some very interesting binaries like tcpdump, tc, etc inside /usr/sbin

    F) Public key auth with dropbear:
    on client machine:

    ssh-keygen -t rsa
    scp .ssh/id_rsa.pub root@netroute.ip:

    on netroute2:

    mkdir .ssh
    mv id_rsa.pub .ssh/authorized_keys
    chmod 400 ~/.ssh/authorized_keys
    chmod 700 ~/.ssh
    /etc/init.d/checkpoint

    If everything is done properly you will now be able to ssh from your client to netroute2 without password.

    I wish I could find more of these great machines. 2 Ethernet ports, usb, serial console, 2 FXS, it’s own small sip compatible PBX … what else can one need ? A usb port for an external disk and a torrent client probably… 🙂

    Wireless Community Networks at their best

    I am back in my hometown, Thessaloniki, for about a week and I carried with me the old laptop that I had tried installing the rule project
    I had nothing to do tonight..so I plugged in my wireless card, booted Damn Small Linux CD and went out to the balcony. Why not try to check if there are any wireless networks around ? In fact there was one:

    root@ttyp2[root]# iwlist ath0 scan
    ath0 Scan completed :
    Cell 01 - Address: 00:30:4F:4B:66:6C
    Mode:Master
    Encryption key:off
    Quality:17/94 Signal level:-78 dBm Noise level:-95 dBm
    Mode:Master
    ESSID:"nkoumle"
    Frequency:2.412GHz
    Bit Rate:1Mb/s
    Bit Rate:2Mb/s
    Bit Rate:5Mb/s
    Bit Rate:11Mb/s

    I connected there..and ran the dhcp client…

    root@ttyp2[root]# iwconfig ath0 essid nkoumle
    root@ttyp2[root]# pump -i ath0

    Drums rolling….ta ta!!

    root@ttyp2[root]# ifconfig ath0
    ath0 Link encap:Ethernet HWaddr 00:20:A6:4C:BD:7F
    inet addr:10.103.5.61 Bcast:10.103.5.63 Mask:255.255.255.192
    UP BROADCAST RUNNING MULTICAST MTU:1500 Metric:1

    The IP seemed quite weird to be from a home…and looked like it was from the range that Thessaloniki Wireless Metropolitan Network (TWMN) was given a few years ago, when each greek major city was given an IP range for their Wireless Networks inside the 10.0.0.0/8 range. Pinging the router/AP gave me results of 10-100ms. I tried finding a spot in the balcony where I could get more stable ping times but I couldn’t find one. It didn’t really matter though…I was so excited that a few msecs wouldn’t stop me!
    Even though I could resolve internet hostnames and addresses I couldn’t ping or browse any internet hosts. Then I tried surfing around TWMN. I opened up http://www.twmn and I looked around. I tried to register with their forums but I couldn’t because they require a confirmation email. Since I can’t access any of my email accounts without internet access I can’t register in their wireless forum either. The bad thing is that it’s not even readable as a wireless guest.
    I knew that TWMN and Athens Wireless Metropolitan Network (AWMN) are linked together, so I tried surfing http://www.awmn. Success!! Everything worked quite smoothly there. I even sent a pm to a TWMN user that I know, orion, from AWMN’s forum.
    Then it was time for IRC. Damn Small Linux features a tiny irc client named “naim”. I tried to connect to irc.twmn…but there was no luck. Then I tried irc.awmn and I got instantly connected.
    I had also heard about AWMN’s proxy mesh network. It’s an effort by many awmn users that share their dsl bandwith by creating a squid proxy mesh network with lots siblings, so there is some kind of load balancing. I started reading the last pages of the thread but I couldn’t find any working proxies. Then I remembered that it was koki that started it all…and looked for her website inside awmn. I came up to http://koko.awmn and there she had information about how to connect to her proxy.
    So I entered 10.20.220.2 port 3128 at my firefox preferences…and that was it!!! SUCCESS! I had full access to websites through koki’s proxy server. I am in Thessaloniki and my “internet provider” is 500km away…in Athens!
    Here’s the traceroute to her proxy server:

    root@ttyp0[root]# traceroute 10.20.220.2
    traceroute to 10.20.220.2 (10.20.220.2), 30 hops max, 40 byte packets
    1 ap.nkoumle.twmn (10.103.5.1) 526.158 ms 151.747 ms *
    2 doom2nkoumle.bb.twmn (10.122.255.177) 143.23 ms 368.749 ms 130.249 ms
    3 taz2doom.bb.twmn (10.107.255.81) 13.83 ms 60.137 ms 317.052 ms
    4 uom2taz.bb.twmn (10.107.255.57) 32.055 ms 14.761 ms 64.038 ms
    5 volto2uom.bb.twmn (10.107.255.33) 82.341 ms 78.228 ms 49.779 ms
    6 sourdos2volto.bb.twmn (10.107.255.49) 83.058 ms 61.406 ms 72.943 ms
    7 dfragos2sourdos.bb.twmn (10.107.255.2) 81.377 ms 41.603 ms 101.131 ms
    8 thmmy2dfragos.bb.twmn (10.106.255.254) 200.073 ms 105.749 ms *
    9 thmmy.swn (10.106.3.1) 65.299 ms 132.49 ms 361.869 ms
    10 10.17.122.158 (10.17.122.158) 529.931 ms 368.65 ms 313.583 ms
    11 10.17.122.131 (10.17.122.131) 417.191 ms 74.76 ms 48.881 ms
    12 10.17.122.129 (10.17.122.129) 64.119 ms 84.001 ms 79.828 ms
    13 10.17.122.169 (10.17.122.169) 82.863 ms 41.323 ms 93.686 ms
    14 10.80.190.121 (10.80.190.121) 87.61 ms 68.538 ms 90.206 ms
    15 10.26.35.181 (10.26.35.181) 132.605 ms 343.975 ms 120.142 ms
    16 10.26.35.54 (10.26.35.54) 134.826 ms 105.009 ms 128.925 ms
    17 10.20.220.74 (10.20.220.74) 79.456 ms 89.032 ms 196.706 ms
    18 10.20.220.2 (10.20.220.2) 144.206 ms 150.446 ms 103.555 ms

    I am actually posting this entry for this insane connection!

    This is really inspiring. Community networks at their best. Thanks a lot to everyone that contributed in order for this to happen. Thanks a lot to nkoumle (whom I don’t know) and to koki (that I only know her though IRC and forums)…

    who said wireless networking in linux is hard ?

    I had for over 2 months a friend’s left over laptop at my house. It’s an old amd K6 333Mhz with 64Mb RAM. Useless ? maybe yes maybe not…I just wanted to see what I coulld do with it…

    I’ve booted it with DSL and I had a nice desktop to work on…now what ? A few days ago I had started preparing a new linux based access point for our local wireless network in the city I study. It had 2 Winstron CM9 802.11a/b/g cards and one netgear MA311 802.11.b card. I also happen to have an orinoco gold 802.11a/b/g pcmcia card I was given some time ago as a gift (even though I don’t own a laptop, yet). So why not mess with these two ? I plugged in the pcmcia in the laptop and it was instantly recognized. Then I just added through ifconfig the IP that I wanted the wireless card to have…and wow! I was associated instantly with the remote linux based AP in the next room. That was easy 🙂 It’s probably a good time now to install dhcp to that AP too so I won’t even need to add an IP manually 🙂

    So all I had to do was give an IP…no drivers…nothing. The card was automatically recognized, and here’s the lsmod part about it:

    root@ttyp0[root]# lsmod | grep ath
    ath_pci 31508 1
    wlan 48520 1 [ath_pci]
    ath_hal 111792 1 [ath_pci]

    By the way…this card is NOT recognized in windows XP without drivers. And if you happen to forgot the drivers cd while travelling…you are probably doomed.

    Good job linux people 🙂

    SSH Escape Characters

    I am sure a LOT of people reading this blog use ssh in their everyday work/life/etc. I am not sure though how many of you have heard of ssh EscapeChar unless you’ve read the ssh_config file (and even if you have done so, did you pay any attention to it ?). So what can you do with EscapeChar ? not a lot, but certainly very usefull stuff.

    My most frequent problem with ssh is sessions that sometimes they don’t end as they are supposed to. You logout from the remote system and you never get a prompt on yours because something has stuck somewhere, sometime. Wouldn’t you wish there was an escape sequence to end this suffering, like telnet’s ctrl+] ? Well there is! Just edit your client’s ssh config file (/etc/ssh/ssh_config for gentoo) and add to the end:
    EscapeChar ~

    now try ssh to a host and when you are in, try this: ~?. You will see a list of helpfull options. The solution to the previous described problem of stale connections is ~.
    Dummy-safe: So to get it to escape press[alt gr] + [~] two times and then [.]
    If that doesn’t work, try pushing Enter before “~”.

    What’s also very helpfull is the ability to start/end portforwarding during an active ssh session! Say you have opened an ssh connection to a host and you now have to portforward a port, what do you do ? New ssh connection with -L/-R options ? nope! You just press ~C and do what you want from the ssh “command shell”.

    enjoy!

    HOWTO remove spikes from RRD graphs

    If you happen to use rrdtool to create graphs to monitor equipment you might have come upon some “spikes” in your graphs. These are perfectly normal and happend due to machines that have rebooted and have reset their counters or other anomalies that might occur.

    There is a script called removespikes.pl made specially to fix these cases. You can either find the tool here: http://oss.oetiker.ch/rrdtool/pub/contrib/removespikes.tar.gz or get it from my blog removespikes.pl.gz

    Extract it, and then type something in the command line like the following:
    for i in /location/of/rrds/*; do /full/path/to/removespikes.pl $i; done;

    You should probably see some messages like these:

    Chopping peak at <!– 2005-10-25 17:00:00 EEST / 1130248800 –>
    Chopping peak at <!– 2005-10-25 19:00:00 EEST / 1130256000 –>

    That’s all…enjoy your graphs.

    no progress…

    Since gcc 3.4 was marked stable on gentoo, I emerged it and even did an emerge -e world. It took me some time because there were more than 600 packages to rebuild. Anyway, mplayer still denies to work with some videos using -vo xv even after the recompilation with the new gcc.
    That’s the error message:

    X11 error: BadAlloc (insufficient resources for operation)?,?% 1 0 32%

    MPlayer interrupted by signal 6 in module: vo_check_events

    I’ll keep trying…

    Btw, I read some rumours that Cisco is going to release callmanager 5 under linux. I hope that becomes a reality because the current callmanager 4.1(3) runs only on windows 2000 and there are times that the whole system freezes for no good reason, or times when IE crashes. The whole configuration of the callmanager is done through a web browser…in order to add a single device you need 10 clicky-clickies…I hope this changes too.

    ser/openser and Cisco ata 188

    I’ve recently installed a ser (SIP express router) in one of my machines (well, in fact it’s more like openser) mostly for self tutoring. The config file was quite a pain to tune. Many many options, many many modules which all look quite usefull, and you can get easily distracted from what you should be doing. Luckilly there are some HOWTO’s (but not complete) around the net.
    What I find about ser/openser VERY stupid and annoying, is that while it’s tools are mostly written in bash they have the default password that comes with the installation hardcoded inside. It would be much easier if the installation procedure asked you for a username/password instead of the defaults “ser/heslo”. Anyway…you can change them later quite easily…but it’s still annoying.
    A tool you might need is sipsak. It’s like a wrapper of some common commands a SIP administrator might frequently need.

    Installing Cisco ata 188 and making it work for ser/openser was trully easy. You have to download the latest sip image (ata_03_02_01_sip_050616_a.zip) for the ata adapter from cisco (you need a password for Cisco’s site) and upload it to your phone (instructions are inside the zip file’s readme file). Inside the zip file that contains the image and some readme’s there are a few other executables that can be used for debugging it. What’s interesting for us linux users? Cisco provides binaries for almost all those tools inside the zip! In fact I upgraded my ata from linux 🙂

    Then go to http://ip.of.ata.given.by.dhcp/dev and you get a very nice menu with quite a lot of options, and some monitors (ethernet, RTP stats) that did not exist in previous versions. Just fill in your username/password, display name and sip proxy server..and you are good to go. The device registers itself without any problems and I was able to make calls to ata 188 from/to Linphone, Kphone and Xten-Lite(both windows and Linux).

    Here’s my testing ata 188:

    cisco ata 188